Download
1 / 42
430 likes | 575 Views
Maine’s Freshwater Biodiversity Spatial & Temporal Patterns ~~~~~~~~~~ Peter Vaux University of Maine, Orono Arlene Olivero The Nature Conservancy, Boston. Maine Aquatic Biodiversity Project ● Vascular plants, fish, herps, macro-inverts. ● > 200,000 geo-referenced taxon records.

E N D
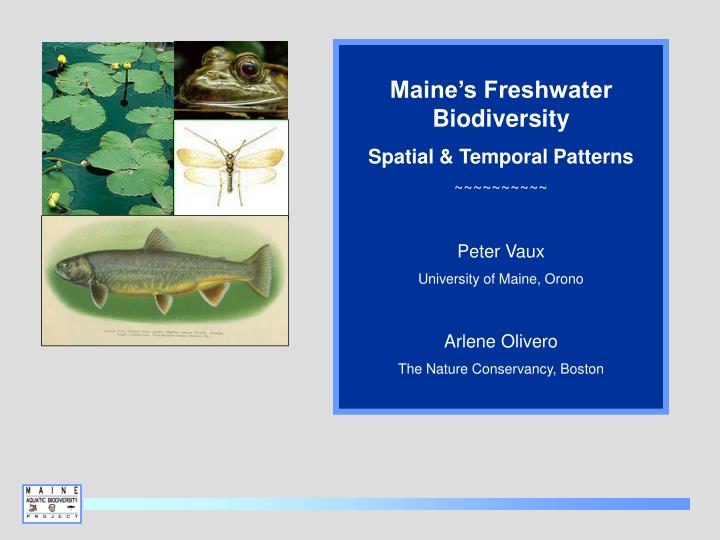
Maine’s Freshwater Biodiversity Spatial & Temporal Patterns ~~~~~~~~~~ Peter Vaux University of Maine, Orono Arlene Olivero The Nature Conservancy, Boston
Maine Aquatic Biodiversity Project ● Vascular plants, fish, herps, macro-inverts. ● > 200,000 geo-referenced taxon records. ● MS Access DB ● Data on-line: PEARL ● Information syntheses: 2005 final report + other publications (in prep.)
Spatial distribution of open-water (A) and wetlands (B), expressed as % cover by watershed (HUC-10). Wetlands include both herbaceous and forested categories. Data from National Land Cover Dataset (1992 imagery)
Fish Herps
Fish Herps Mussels
Fish Herps Mussels Snails
Fish Herps Mussels Snails Mayflies
Fish Herps Mussels Snails Mayflies Stoneflies
Fish Herps Mussels Snails Mayflies Stoneflies Odonates
Fish Herps Mussels Snails Mayflies Stoneflies Odonates Caddisflies
Fish Herps Mussels Snails Mayflies Stoneflies Odonates Caddisflies Plants
Locations of MDEP stream macroinvertebrate assemblage sampling sites. Sites are coded by number of years in the data record. Data source: MDEP, 2004 (data current through 2003).
Sites sampled for fish assemblages using standardized protocols and effort levels.
Tomah mayfly (Siphlonisca aerodromia) survey sites, with presence / absence records. Data sources: Gibbs et al. 2001; MDIFW.
(B) • (A) Number of tracked odonates, as % of total number of species recorded from the watershed. • (B) Frequency of occurrence of tracked odonate species, by HUC-10. (A)
Watersheds containing Atlantic salmon distinct population segments.
Number of rare aquatic plant species recorded by small watershed (HUC-12).
Number of amphibian (left panel) and turtle (right panel) species by county. Data sources: multiple, as compiled in MABP database (major source is MARAP).
Fish species richness by large watershed (HUC-8). (A) Total species, (B) % Maine natives. Species totals refer to the cumulative number of species (lake or stream) in each watershed.
Geographic variation in the native species complement of lake and stream fish assemblages. Stream data refer to % Maine-native species at indicated sampling sites. Lake fish assemblage data are summarized at the watershed level, i.e. the average % natives per lake among all lakes within a watershed. Note that this individual-lake measure is not the same as the cumulative native species richness within a watershed. Lake data are from the MDIFW lake inventory (2004 update); stream data are from the MDIFW brook trout monitoring program. The few watersheds shown in white contain no lake data.
(B) Fish species richness vs. lake area & cumulative lake area
Regional variation in the proportion of native minnows in lake fish assemblages. Box plots show the number of native minnow species per lake expressed as percent of the each lake’s total fish species. Golden shiner was excluded from minnow species totals because, although it is native to Maine, it has been introduced to many waters throughout the state.
Spatial distribution of lake fish assemblage groups identified by agglomerative cluster analysis.
Documented species richness by watershed (HUC-8):Mussels, Mayflies, Odonates
Cambarus bartonii bartonii Orconectes immunis O. limosus O. virilis O. rusticus O. obscurus Procambaurus acutus acutus P. clarkii Maine’s crayfish
Frequency of occurrence of mayfly & odonate species: # HUC-10 watersheds in which species have been recorded.
(A) Chironomids: (A) Frequency of occurrence. (B) Species richness in stream samples (B)
Number of lakes and • streams stocked • by MDIFW • 1937-2003: • all fish species, • smallmouth/ • largemouth bass. (A) (B)
Species : Effort Relationships Mayflies Odonates Mussels
Species – effort plot for vascular plants, Highland Lake, Windham/Falmouth Source data courtesy of K. Williams
Acknowledgements Nancy Sferra, Barbara Vickery, Dave Courtemanch, Peter Bourque, Cyndy Loftin, Molly Docherty, Alex Huryn, Ken Warner, Rich Dressler & MANY others The Nature Conservancy, ME Dept. Environmental Protection ME Dept. Inland Fisheries & Wildlife ME Atlantic Salmon Commission ME Outdoor Heritage Fund