Download
1 / 27
270 likes | 386 Views
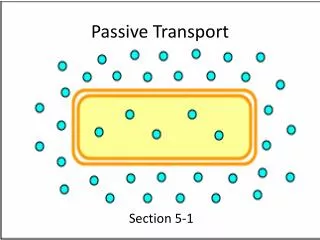
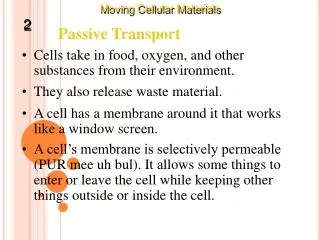
2) PASSIVE TRANSPORT IN RED BLOOD CELLS Observations of Passive Transport in RBC.

E N D
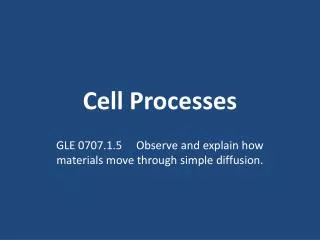
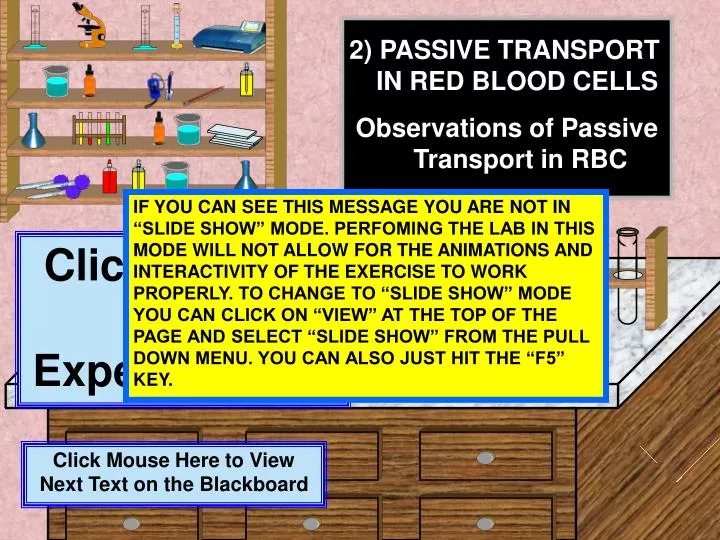
2) PASSIVE TRANSPORT IN RED BLOOD CELLS Observations of Passive Transport in RBC IF YOU CAN SEE THIS MESSAGE YOU ARE NOT IN “SLIDE SHOW” MODE. PERFOMING THE LAB IN THIS MODE WILL NOT ALLOW FOR THE ANIMATIONS AND INTERACTIVITY OF THE EXERCISE TO WORK PROPERLY. TO CHANGE TO “SLIDE SHOW” MODE YOU CAN CLICK ON “VIEW” AT THE TOP OF THE PAGE AND SELECT “SLIDE SHOW” FROM THE PULL DOWN MENU. YOU CAN ALSO JUST HIT THE “F5” KEY. Click Here To Start Experiment #2 Click Mouse Here to View Next Text on the Blackboard
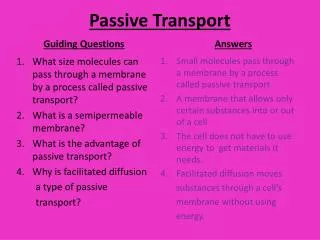
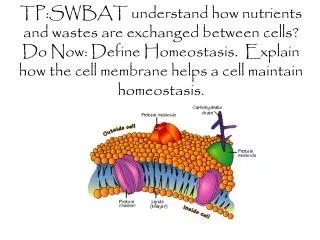
To magnify the blackboard click on it to view a discussion on membrane transport The plasma membrane is a Selectively Permeable membrane that surrounds the cell. The passive movement of water and dissolved substances across the membrane requires permeability through the membrane. In order for substances to diffuse across the plasma membrane, they must be permeable to the membrane. Substances such as oxygen and carbon dioxide easily diffuse across the plasma membrane. Osmosis is the diffusion of water through a selectively permeable membrane. Water will generally move quite freely through the cell membrane by diffusion. Osmotic movement of water occurs when the solute (non-penetrating) concentrations differ between the opposing sides of the cell membrane. Click Mouse Here to View Next Text on the Blackboard
A difference in solute (non-penetrating) concentrations means there is a difference in water concentrations and water will move from the region of higher concentration to a region of lower concentration. For example, water osmotically moves into a cell when the fluid outside the cell has more water (less solutes) than the fluid inside the cell. In this case, as water moves into the cell, it swells as the water pressure inside the cell increases. Tonicity is the ability of a solution to affect the movement of water by osmosis, thus the shape of the cell, is called tonicity. There are three possible tonicities of solutions that produce three cell shapes. Click Mouse Here to View Next Text on the Blackboard
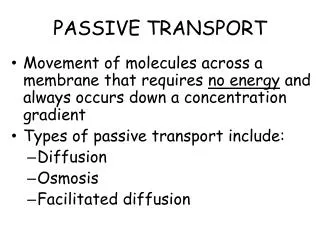
The three possible tonicities are as follows: • Isotonic solutions which produce a normal shaped cell • Hypotonic solutions which causes cells to swell • Hypertonic solutions which causes the cell to shrink Click Mouse Here to View Next Text on the Blackboard
ISOTONIC SOLUTIONS An isotonic solution has the same concentration of solutes as within the cell. Equal concentrations of solutes means that there are equal concentrations of water. There is no net diffusion of water, and the cells maintain a normal shape. Click Mouse Here to View Next Text on the Blackboard
HYPOTONIC SOLUTIONS A hypotonic solution has a lower concentration of solutes than within the cell. Since the solution has a lower concentration of solutes, it has a higher concentration of water, and net water diffusion is into the cell. Water movement into the cell increases its internal pressure and the cell swells until it bursts or lysis. Click Mouse Here to View Next Text on the Blackboard
HYPERTONIC SOLUTIONS A hypertonic solution has a higher concentration of solutes than within the cell. Since the solution has a higher concentration of solutes, it has a lower concentration of water, and net water diffusion is out of the cell. Water movement out of the cell decreases it internal pressure and the cell shrinks and crenates. Click Mouse Here to View Next Text on the Blackboard
Because red blood cells have very flexible cell membranes, they can be used to show the effects that solutions of different tonicities have on a cell shape. Most cells in the body have the ability to counteract the effects of changes in tonicity. These cells may have special proteins embedded into the cell membrane which act to equalize the internal pressures within the cell to inhibit major changes in their shape. Red blood cells lack these proteins in their cell membranes. Click Mouse Here to View Next Text on the Blackboard
The blood which we will be using in this experiment is human blood. If you become exposed in any way to the blood you must immediately notify your instructor. He will probably tell you to restart your computer so that you do not become infected with a disease. You will be provided with: 3 different tonicity solutions 1 vial of human blood 3 microscope slides 3 eyedroppers microscope Click Mouse Here to View Next Text on the Blackboard
LAB REPORT • You will need to supply the following in your lab report for this experiment #2 • Sketch of red blood cell in isotonic solution • Sketch of red blood cell in hypotonic solution • Sketch of red blood cell in hypertonic solution • Answers to questions 1 - 3 Click Mouse Here to View Next Text on the Blackboard
MATERIALS Beaker of isotonic solution (0.9% saline)Beaker of hypotonic solution (0.7% saline)Beaker of hypertonic solution (0.11% saline) Eyedroppers Vial of Human blood Three microscope slides Light microscope Click Mouse Here to View Next Text on the Blackboard
Procedure Obtain the three beakers of solution by clicking on each of the blue beakers which lie on the shelf to your left 0.9% 0.7% 0.11% Click Mouse Here to View Next Instructions on the Blackboard
Procedure Obtain the vial of blood from the shelf on your left by clicking on the red bottle 0.9% Blood 0.7% 0.11% Click Mouse Here to View Next Instructions on the Blackboard
Procedure Obtain the three microscope slides by clicking on them. *You can find the slides on the shelf to your left 0.9% Blood 0.7% 0.11% Click Mouse Here to View Next Instructions on the Blackboard
Procedure Label each of the slides as 0.7 and 0.9 and 0.11.*You can do this by clicking on the pencil on the shelf to the left 0.9% Blood 0.7% 0.11% 0.7 0.11 0.9 Click Mouse Here to View Next Instructions on the Blackboard
Procedure Place one drop of blood on each of the slides. You can accomplish this by clicking on the dropper of the vial containing the blood 0.9% Blood 0.7% 0.11% 0.7 0.11 0.9 Click Mouse Here to View Next Instructions on the Blackboard
Now add one drop from each of the solutions to the blood samples on each of the corresponding slides. Click on a blue eyedropper on the shelf to the left to accomplish this. You will need a new, fresh dropper for each sample Click on another eyedropper 0.9% Blood 0.7% 0.11% 0.7 0.11 0.9 Click Mouse Here to View Next Instructions on the Blackboard
0.9% Blood 0.7% 0.11% We will now view each of the slides using a compound light microscope. Bring the microscope to the table by clicking on the microscope at the top of the shelf to the left 0.7 0.11 0.9 Click Mouse Here to View Next Instructions on the Blackboard
0.7 0.11 0.9 Click on the slide which is marked as 0.9 (Isotonic) Once the slide is in place click on the focusing knob to see the magnified image at 450 X
0.7 0.11 0.9 Sketch the image you see at 450 X and label it as ISOTONIC 450 X. In order to see individual blood cells at 1200 X click on the objective of the microscope to turn to high power. Red Blood Cells in an isotonic solution have a normal size and shape. They are biconcave discs. Their thin central region is formed from the two concave sides. Sketch the image at 1200 X and label as ISOTONIC 1200X. 1200 X 450 X Click Mouse Here to View Next Instructions on the Blackboard
0.7 0.11 0.9 Click on the slide which is marked as 0.7 (Hypotonic) Once the slide is in place click on the focusing knob to see the magnified image at 450 X
0.7 0.11 0.9 Sketch the image you see at 450 X and label it as HYPOTONIC 450 X. In order to see individual blood cells at 1200 X click on the objective of the microscope to turn to high power. Red Blood Cells in a hypotonic solution have a swollen appearance. The net inward movement of water increases intracellular pressure, and the cells swell and loose their biconcave shape. As intracellular pressure continues to increase, a point is reached where the cells rupture. Distinctive cells may be difficult to locate as mostly cell fragments remain. Sketch the image and label as HYPOTONIC 1200 X. 1200 X 450 X Click Mouse Here to View Next Instructions on the Blackboard
0.7 0.11 0.9 Click on the slide which is marked as 0.11 (Hypertonic) Once the slide is in place click on the focusing knob to see the magnified image at 450 X
0.7 0.11 0.9 Sketch the image you see at 450 X and label it as HYPERTONIC 450 X. In order to see individual blood cells at 1200 X click on the objective of the microscope to turn to high power. Red Blood Cells in a hypertonic solution have a crenated (shrunken) appearance. The net movement of water out of the cells causes the cells to have a “prune like” appearance. Sketch the image and label as HYPERTONIC 1200X. 1200 X 450 X Click Mouse Here to View Next Instructions on the Blackboard
The image below will help to show you what is happening to the RBC as you introduce the different solutions to them Click Mouse Here to View Next Instructions on the Blackboard ISOTONIC HYPOTONIC HYPERTONIC
Answer the following questions about your observations of passive transport in red blood cells • Describe the appearance of red blood cells in an isotonic solution • Describe the appearance of red blood cells in a hypotonic solution • Describe the appearance of red blood cells in a hypertonic solution Click Mouse Here to View Next Slide
At this point you have finished experiment # 2 for this lab Would you like to end your session or continue to the next experiment? End this Session Continue to Experiment #1 (DIFFUSION RATE) Continue to Experiment #3 (OSMOSIS AND DIALYSIS)