Download
1 / 31
310 likes | 634 Views
Basic Graphs. Trigonometry MATH 103 S. Rook. Overview. Section 4.1 in the textbook: The sine graph The cosine graph The tangent graph The cosecant graph The secant graph The cotangent graph Even and odd functions. The Sine Graph. The Sine Graph.

E N D
Basic Graphs Trigonometry MATH 103 S. Rook
Overview • Section 4.1 in the textbook: • The sine graph • The cosine graph • The tangent graph • The cosecant graph • The secant graph • The cotangent graph • Even and odd functions
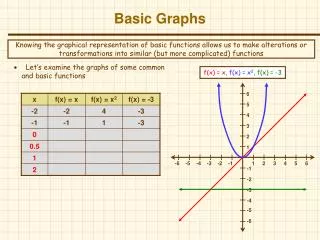
The Sine Graph • Recall how to graph a line by using a table of values: • e.g. y = 2x • Pick values for x and then calculate y for y = sin x • e.g. • All points on the sine graph can be written as (x, sin x) • Obtained from the known values on the Unit Circle
The Sine Graph (Continued) • Finally, plot the points • At this point, you should mainly be concerned with recognizing the shape of the graphs of the six trigonometric functions
The Sine Graph and the Unit Circle • Recall that on the Unit Circle, (x, y) corresponds to (cos θ, sin θ) • For the sine graph, we are only concerned with the value of y: • QI: y increases to 1 • QII: y decreases to 0 • QIII: y decreases to -1 • QIV: y increases to 0
Period • Given a function f(x), the period is the smallest value p such that f(x + p) = f(x), for all x in f • i.e. when the graph starts to repeat – the length of ONE cycle • All six trigonometric functions are periodic (repeat in an infinite number of cycles) • One cycle of y = sin x consists of tracing out the Unit Circle as θ varies from 0 to 2π • The graph of y = sin x does not repeat in this interval • When θ ≥ 2π, the graph of y = sin x starts to repeat • Therefore, the period of y = sin x is 2π p = 2π
Period and Extending Graphs • To extend the graph of a trigonometric function: • Utilize its period • By adding 2π to each x in the previous table of values, we obtain the next cycle of the sine graph • By adding 2πk (where k is an integer) to each x in the previous table of values, we obtain the same y-value in another cycle of the sine graph k can be negative meaning the cycles extend infinitely in both directions
The Sine Graph (Example) Ex 1: Extend the table of values for y = sin x to include the next cycle (i.e. 0 ≤ x ≤ 4π)
The Cosecant Graph • Recall the relationship between y = sin x and y = csc x: • Thus, we take the reciprocal of the values from the sine graph to obtain the cosecant graph • Note that some of the reciprocals will have a 0 in the denominator: • Will be undefined (e.g. π) • The graph will have a vertical asymptote at these points
The Cosecant Graph (Continued) • Plot the points • Again, be able to recognize the shape • Because y = sin x and y = csc x are reciprocals, y = csc x also has a period of 2π • We can use the same method to extend the cosecant graph as we did to extend the sine graph
The Cosine Graph • All points on the cosine graph can be written as (x, cosx) • Obtained from the known values on the Unit Circle • When drawing the cosine graph, we trace out the entire Unit Circle as θ varies from 0 to 2π without the graph repeating • Therefore, the period of the cosine graph is 2π • By adding 2πk to each x, we get the same y-value in another cycle of the cosine graph
The Cosine Graph (Continued) • Plot the points • Again, be able to recognize the shape of the graph • We can extend the cosine graph just like how like how we extended the sine graph
The Cosine Graph and the Unit Circle • Recall that on the Unit Circle, (x, y) corresponds to (cos θ, sin θ) • For the cosine graph, we are only concerned with the value of x: • QI: x decreases to 0 • QII: x decreases to -1 • QIII: x increases to 0 • QIV: x increases to 1
The Cosine Graph (Example) Ex 2: Extend the table of values for y = cos x to include the previous cycle (i.e. -2π ≤ x ≤ 2π)
The Secant Graph • Recall the relationship between y = cos x and y = sec x: • Thus, we take the reciprocal of the values from the cosine graph to obtain the secant graph • Note that some of the reciprocals will have a 0 in the denominator: • Will be undefined (e.g. π⁄2) • The graph will have a vertical asymptote at these points
The Secant Graph (Continued) • Plot the points • Again, be able to recognize the shape • Because y = cos x and y = sec x are reciprocals, y = sec x also has a period of 2π • We can use the same method to extend the secant graph as we did to extend the other graphs
The Tangent Graph • Recall the relationship of tan x between sin x and cos x: • Remember that on the Unit Circle, (x, y) corresponds to (cos θ, sin θ): • Thus we can create a table of values • Again, the graph will have a vertical asymptote where the tangent is undefined
The Tangent Graph (Continued) • Plot the points • Notice that the period of the tangent graph is π, NOT 2π • The graph in QI & QII will be the SAME as the graph in QIII & QIV (in reference to the unit circle) • To extend the tangent graph, add kπ to each value in the previous table • Yields the same y-values in another cycle
The Tangent Graph (Example) Ex 3: Extend the tangent graph from -π ≤ x ≤ 2π
The Cotangent Graph • Recall the relationship between y = tan x and y = cot x: • Thus, we take the reciprocal of the values from the tangent graph to obtain the cotangent graph • Like the tangent graph, the cotangent graph has a period of π
The Cotangent Graph (Continued) • Plot the points • As with all the other graphs, be able to recognize the shape • Can extend the graph like the others
Even and Odd Functions • Recall the definition of even and odd functions: • If f(-x) = f(x), f(x) is an even function • If f(-x) = -f(x), f(x) is an odd function • Examine the Unit Circle at the right: cos(-θ) = cos θ meaning? sin(-θ) = -sin θ meaning? • Using identities, we can infer whether the remaining trigonometric functions are even or odd
Even and Odd Functions (Example) Ex 4: Show or evaluate the following: a) b) Show that cot(-θ) is an odd function c) cos(-θ) tan θ = sin θ
Summary • After studying these slides, you should be able to: • Recognize the shape of the graphs of the six trigonometric functions • State the period for each trigonometric function • Work with even and odd functions • Additional Practice • See the list of suggested problems for 4.1 • Next lesson • Amplitude, Reflection, and Period (Section 4.2)