Download

1 / 30
310 likes | 398 Views
Future Opportunities for Coal Power. Science, Regulations, & Technology. Energy Crisis!. Comparing U.S. Energy Reserves. Abundant Resources Relate to Stable Prices. 6,000. 5,000. 4,000. 3,000. 2,000. 1,000. 0. US Coal Reserves. US Gas Reserves. US Oil Reserves.

E N D
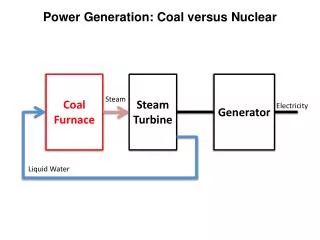
Future Opportunities for Coal Power Science, Regulations, & Technology
Comparing U.S. Energy Reserves Abundant Resources Relate to Stable Prices 6,000 5,000 4,000 3,000 2,000 1,000 0 US Coal Reserves US Gas Reserves US Oil Reserves (in quadrillion BTU’s) Source: EIA, 2000
Delivered Fuel Cost – U.S. Coal’s Stable Pricing Makes it Ideal for Generation Delivered Fuel Cost For Generation Natural Gas Oil Coal Mar 03 Mar 02 Jun 02 Dec 98 Sep 99 Dec 99 Sep 00 Dec 00 Sep 01 Dec 01 Sep 02 Dec 02 Mar 99 Jun 99 Mar 00 Jun 00 Mar 01 Jun 01 Source: EIA Electric Power Monthly, February 2003
Louisiana Costs - 2003 • Fuel Cost • Coal $1.34 mmbtu • Natural Gas $5.50 mmbtu • Oil $5.84 mmbtu Average electric cost in the state is $0.069/kwh – 6% below the national average.
Louisiana Electric Generation Mix • Natural Gas 45% • Coal-based 26% • Nuclear 18% • Renewable 4% • Oil 3%
Environmental Progress SO2 NOx PM 10 Source: U.S. Environmental Protection Agency and Department of Energy, 2002
2003 Average State Coal Fired SO2 Emission Rates 2003 Average US Coal Rate- 0.99#SO2/MMBtu Source: EPA 2003 CEMS Data
2003 Average State Coal Fired NOx Emission Rates 2003 Average US Coal Rate 0.37#NOx/MMBtu Source: EPA 2003 CEMS Data
Regional Transport Rule 1-hr Severe Area Attain-ment Date Marginal 8-hr Ozone NAAQS Attain-ment Date 8-hr Ozone Attain-ment Demon-stration SIPs due 1-hr Serious Area Attainment Date Assess Effectiveness of Regional Ozone Strategies Designate areas for 8-hr Ozone NAAQs NOx SIP Call Re-duc tions Moderate 8-hr Ozone NAAQS Attainment Date Possible Regional NOx Reductions? (SIP call II) NOx SIPs Due OTC NOx Trading Section 126 NOx Controls Serious 8-hr Ozone NAAQS Attainment Date Proposed Utility MACT Compliance for BART Sources Compliance with Utility MACT Compliance for BART sources under the Trading Program Latest Attainment date for Fine PM NAAQS Designated Areas for Fine PM NAAQS New Fine PM NAAQS Implementation Plans Mercury Deter-mination Haze Sec. 309 SIPS due Phase II Acid Rain Compliance Second Regional Haze SIPs due Clean Air Interstate Rule to Address SO/NOx Emissions for Fine PM NAAQS and Regional Haze Final Utility Mercury Rule Additional Hg regulation under 112(d) and (f) Regional Haze SIPs due
Proposed Federal Clean Air Interstate Rule Further Reductions Required by Texas by 2015: SO2 – 70% reduction NOx – 65% reduction
Clean Air Interstate Rule • NOx • 68,498 tons 2003 • 39,444 tons 2015 • SO2 • 119,930 tons 2003 • 41,976 tons 2015
Proposed Utility Mercury Reduction Rule • MACT - Up to 90% reduction by 2008 • Facility specific control • Cap & Trade - 70% reduction by 2018 • Market-based approach • Reduce from current 48 tons to 15 tons • Estimated to save consumers $8 Billion - 2020
Foreign Contribution • Fact: Wildfires, prescribed burns, and crop burning alone emit some 800 tons of mercury each year globally – National Center for Atmospheric Research • Fact: 50% of the mercury found in the U.S. is from foreign sources – U.S. EPA • Fact: The world’s oceans contains millions of tons of mercury which impacts the mercury in the atmosphere – National Center for Atmospheric Research
Global Mercury Deposition in the U.S. Percent of mercury deposition that originates outside of the U.S. Source: EPRI
Mercury Facts – local deposition • “Given the current scientific understanding of the environmental fate and transport of this element, it is not possible to quantify how much of the methylmercury in fish consumed by the U.S. population is contributed by U.S. emissions relative to other sources of Hg (such as natural sources and reemissions from the global pool).” – EPA proposed rule
Local Deposition • Facts: Only 4 – 7% of mercury is deposited locally, according to research by the Brookhaven National Laboratory • “Only a small percentage of the mercury would be deposited nearby as particles fall to earth, while the vast majority drifts to greater distances in the atmosphere.” Hans Friedli, National Center for Atmospheric Research
Louisiana’s Mercury Emissions • Fact: Coal-based power plants in Louisiana emit less than half a ton of mercury – U.S. EPA • Fact: This equates to less than 0.01 of 1% of the total global mercury emissions – U.S. EPA • Fact: Louisiana coal-fueled power plants emit 265 lbs. of oxidized mercury, with the remaining 740 lbs. in an elemental form – U.S. EPA
Health Concerns • Fact: The national Health and Nutrition Survey, which measured actual mercury levels in women and children did not find anyone approaching the lowest level that would have been associated with any measurable health effect due to mercury – U.S. Center for Disease Control • “ People consume far higher levels of PCBs and other persistent environmental chemicals in other foods, including beef, poultry, and dairy products.” - National Academy of Science
Benefits of Fish The American Heart Association predicts about 250,000 people die from sudden heart attacks each year. If 40 percent of these people ate more fish, which contains the beneficial omega fatty acids, 100,000 people would increase their odds of avoiding sudden death. Scaring the public away from eating fish can in itself be a health concern.
Capturing Mercury is Difficult • Hypothetical Example • Houston Astrodome filled with 30 billion ping-pong balls • 30 green “mercury” balls • Find and remove 27 green balls for 90% Hg capture • EPA has said “So, is • technology capable of getting • a 90-percent reduction of • mercury from coal-fired power • plants in the near future?” EPA’s answer is NO! Houston Astrodome
Cost to Control • Fact: The estimated cost of removing mercury from a power plant is $70,000 per pound – U.S. EPA • Fact: A Tennessee Valley Authority study compared the cost of removing mercury versus other emissions: • Sulfur Dioxide $200 a ton • Nitrogen Oxide $2,000 a ton • Mercury $200,000,000 a ton
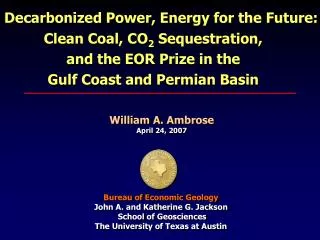
FutureGen – Energy Renaissance One billion dollar, 10-year demonstration project to create world’s first coal-based, zero-emission electricity and hydrogen plant President Bush, February 27, 2003
Wabash River 1996 Powerplant of Year Award* Achieved 95% availability Tampa Electric 1997Powerplant of Year Award First-dispatch power generator IGCC Technology in Early CommercializationU.S. Plants in CCT Program Nation’s First Commercial-Scale IGCC Plants, Each Achieving > 95% Sulfur Removal > 90% NOx Reductions *Power Magazine
Sequestration: A Key Objective FutureGen will: • Test new technologies to capture CO2 at power plant • Inject CO2 into geologic formations • Measure and monitor to verify permanence of storage Enhanced Oil Recovery And/Or CO2 Pipeline Geologic Sequestration
Example: Weyburn CO2 EOR Project • Approximately 650 production and water injection wells on a 70-square mile oil field operated by EnCana Resources. • A 20-year enhanced oil recovery (EOR) project begun in 2000 using CO2 from a 200-mile CO2 pipeline from Dakota Gasification Plant — $20.5 million cooperative agreement with Canadian Federal and Saskatchewan Provincial Governments. Provides for 130 million barrels of oil and storage of about 20 million metric tons of CO2 over 20-year lifetime. • U.S. (DOE), EU, Japan, Alberta Government, private companies (e.g., BP, Chevron-Texaco, etc.) have joined, providing another $20 million. IEA CO2 Monitoring and Storage Project coordinated by 20 research organizations in the U.S., UK, Canada, France, and Italy.
FutureGen . . . • Produce electricity and hydrogen from coal using advanced technology • Emit virtually no air pollutants • Capture and permanently sequester CO2 • Addresses three Presidential initiatives: • Hydrogen • Clear Skies • Climate Change
The Future is Bright Randy Eminger Vice President – South Region Center for Energy and Economic Development (806) 359-5520 reminger@ceednet.org