Download
1 / 24
240 likes | 417 Views
Leveraging the Investment Decision Process: Dynamically Managing Beta and Alpha. Dr. Arun S. Muralidhar Chairman M cube Investment Technologies, LLC 21 July 2005. Set Static Strategic Asset Allocation Using ALM. Hire Managers

E N D
Leveraging the Investment Decision Process: Dynamically Managing Beta and Alpha Dr. Arun S. Muralidhar Chairman Mcube Investment Technologies, LLC 21 July 2005
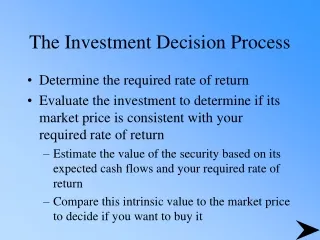
Set Static Strategic Asset Allocation Using ALM Hire Managers on a Static Basis (incl. Currency) Consider Simple Rebalancing Strategies Dynamic “Beta” Management Dynamic “Alpha” Management Roadmap: From Static to Dynamic Portfolios • Traditional approach – Alpha from external managers • New approach – Add alpha from informed decisions • Transparency and governance are critical
Client’s Investment Philosophy • Asset allocation: key source of return • Ranges will be maintained through a disciplined rebalancing program • Diversification by and within asset class is the primary risk control element • Passive alternatives to actively managed portfolios are preferred, especially in highly efficient markets
Key Conclusions • Separating “alpha” from “beta” - Too much focus on alpha, not on beta • Little focus on impact versus liabilities • Dynamic alpha and beta management may be more valuable than static alpha • All portfolio decisions (incl. rebalancing) impact returns and risks; Must make decisions in an informed manner
Benchmark Misfit Risk Asset Allocation Decision Manager Selection and Allocation Investment Decision Process (IDP): Many Embedded Decisions Total Portfolio/Liabilities Cash 0% Equity 64% Fixed Income 23% Alternatives 13% Core 21% HY 1.5% Emerging 0.5% Non US 24% Domestic 40% RE 9% PE 4% ACWI SC EMG LC SC Important to manage/monitor each decision and understand individual and aggregate contribution to risk/return
The “Old” Static Framework for Beta • Passive: Calendar or range-based rebalancing • Dutch model: benchmark includes drift until range is met or calendar period is completed • When range hit, go either to range or target or in-between (what happens within range???) • +/- 3% range for most assets; 4% for RE • Client policy gives discretion = Tracking Error
The “Old” Static Framework for Alpha • Single asset class focus: Optimize information ratio on active managers for a risk budget • M3 measure shows why this is incorrect (for single and multi-manager portfolios) • Modigliani2: Could hire a negative IR manager! • Dynamic management of alpha: Cash flows make pension funds active – already make decisions on who to give money to and when!
Understanding Diversification or “Low Correlations” • Also means asset class performance will go through cycles – this aspect is often ignored • Intelligent staff cannot sit by as markets evolve • Managers can have low correlation with others • Manager cyclicality – why fund a manager who is starting to underperform? • Role of cash flows in implementing DYNAMISM
Passive Rebalancing: Can Be “Risky”* • Buy and Hold: Let Portfolio Drift • 0.16% annualized return; 1.09% tracking error • Worst drawdown = -2.15% (multi-year period) • +/-3% range for most assets; 4% for RE** • Impact: 0.01% annualized return for 0.21% risk • Worst drawdown: much lower at –0.43% *Rebalancing was evaluated from 01/99 – 04/05. Only tested at the highest portfolio benchmark level. Transactions costs (one way) = 15 bps for equity; 10 bps for fixed income; 0.5% for alternatives **Range-based rebalancing = if any asset drifts to the range limit, all assets are rebalanced to benchmark
“Passive” Rebalancing: Not Cost/Risk Neutral (Cost 15 bps/yr) Buy and Hold Ann Ret: 0.16% Drawdowns!! Rebalancing Ann Ret: 0.01% Source: AlphaEngineTM
“Passive” Rebalancing: Not Cost/Risk Neutral (Cost 15 bps/yr) Buy and Hold Ann Ret: 0.16% Rebalancing Ann Ret: 0.01% Source: AlphaEngineTM
Informed Decisions within Ranges – Dynamic Beta Management • Portfolio rebalancing is an “active” decision • Use cash flows to structure fund appropriately • Investment decision process creates opportunity • Large cap vs. Small cap (+/-2%) • Core vs. HY vs. EMG (+/-2%) • EAFE vs. EMG vs. Small (+/-2%) Can staff use discretion to create value? Key: Have a robust, transparent, consistent process
Improving the Quality of Decisions • Test variety of rules to use for specific decisions • Consistent evaluation and performance metrics • Many resources can be tapped • Internal staff – have ideas that are unused • Research: many articles on when asset classes do well • Leverage external managers/relationships – Verizon • Transparency and process key for good governance “Prudence is Process”
Focused on a Few “Beta” Decisions Total Portfolio/Liabilities Asset Allocation - Equity vs Cash Asset Allocation - Equity vs FI Cash 0% Equity 64% Fixed Income 23% Alternatives 13% Fixed Income - Core vs HY Foreign 24% Domestic 40% Core HY Foreign Equity - ACWI vs EMG Domestic Eq. - LC vs SC ACWI EMG LC SC Chose a few decisions to make the point Developed multiple rules to diversify the risk for each strategy
Description of “Beta Management” Rules • Equity vs Fixed Income vs Cash • Price of Oil; Slope of Yield Curve, Equity Momentum, “Halloween Rule”; Fed Model • Annual Turnover was only 5% • Equities (ACWI vs EMG; Large vs Small Cap) • Liquidity, EMG spreads; VIX, Yield Curves, Credit • Annual Turnover was only 5% • Bonds (HY vs Governments) • Eq performance and VIX; Yield Curve, Halloween • Annual Turnover was only 4%
Informed Decisions/Managing Beta: Improved Risk/Return * • Asset allocation level: Keep return relative to “Buy and Hold”; lower risk relative to Rebalancing • Stay within passive rebalancing guidelines • Add returns at every level of IDP – alpha compounds Excess Annualized Tracking Information Worst Confidence Success Return Error Ratio Drawdown in Skill Ratio 57% Asset Allocation level 0.16% 0.19% 0.81 -0.21% 98% Domestic Equity 0.08% 0.19% 0.43 -0.35% 85% 55% Foreign Equity 0.04% 0.12% 0.36 -0.21% 82% 53% Fixed Income 0.04% 0.07% 0.57 -0.18% 92% 56% *All Decision regimes were evaluated from 01/99 – 04/05. Transactions costs were higher for sub-asset class level. Decision making frequency was monthly Source: AlphaEngineTM
Excess Annualized Tracking Information Worst Confidence Success Return Error Ratio Drawdown in Skill Ratio Buy and Hold 0.16% 1.09% 0.14 -2.19% 69% 51% Strict +/-3% Rebalancing 0.01% 0.21% 0.03 -0.43% 53% 42% Informed Decisions 0.32% 0.21% 1.5 -0.18% 99% 64% Comparing Impact on Entire Fund • At total fund level, better return with lower risk • Drawdown at total fund level is also lower • Translates into meaningful $$s = $180 mn/yr! Source: AlphaEngineTM
Managing Beta = “Alpha” ($) + Risk Management = Good Governance Informed Decisions Ann Ret: 0.32% Drawdown is ½!! Rebalancing Ann Ret: 0.01% Source: AlphaEngineTM
Ideas for “Alpha” Management • UK vs Euro ex-UK managers: favor mgr in market with a higher interest rate • Added 0.37% annualized over a static mix • Govt. bonds: favor the manager with greatest momentum over last 3 months • Added 0.27% ann. over a static mix of 4 mgrs • Convertible Arbitrage vs Fixed Income Arb • Allocate to mgrs depending on VIX and OAS • Added return over static with 12% turnover!
Dynamic Alpha and Beta Management can Lower A-L Risk Annualized Liability Return (Benchmark) = 8.2% Note: These results are indicative and were obtained from another fund using the “informed decision” approach ( 2001-2005)
Summary • Many clients focus only on SAA, Rebalancing and Static Allocations to External Managers • Using dynamism in portfolio can lead to additional returns and lower Surplus-at-Risk • Dynamism: both managing beta and alpha • Cheaper source of excess return at total fund level (than any other “alpha” option) • Easy to adopt by leveraging external relationships
Tracking error vs. excess returns (net of fees) US Equity Large Cap US Fixed Income 5 High Yield 4 Non-US Equity EAFE 3 Non-US Equity EAFE - Japan Lite Emg Mkt Equities 2 Excess return Non-US Fixed Income 1 US Equity Small Cap US Equity Mid Cap 0 Non-US Fixed -1 Income - Japan Lite 0 2 4 6 8 10 12 Tracking error Where Should a Fund Take Risk? • Consistent with Client philosophy – WHO IS THE MUG? From 12/87 to 12/97 Source: Muralidhar (2001), Innovations in Pension Fund Management
Contact Information Name: Dr. Arun S. Muralidhar Title: Chairman Company: Mcube Investment Technologies, LLC Phone: 1-646-591-6991 E-mail: asmuralidhar@mcubeit.com Website address: www.mcubeit.com