Download
1 / 7
70 likes | 207 Views
A. B. Figure 1. Marker. Rat. Rat. BRL cell. Marker. BRL cell. B. A. 586bp. 471bp. Figure 2. Marker. BRL cell. Rat. Marker. M. D. U. C. 601bp. 201bp. Figure 2. 208bp. Marker. E. 480bp. 381bp. 330bp. 457bp. Figure 2. A. Figure 3. B. Figure 3. 120.

E N D
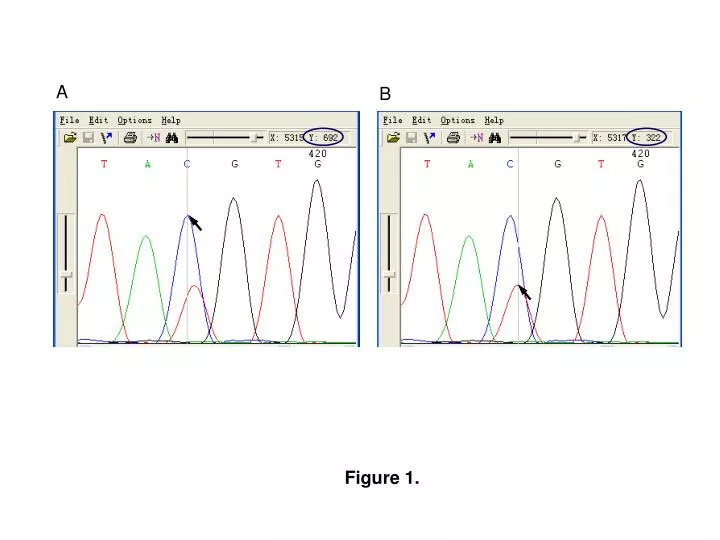
A B Figure 1.
Marker Rat Rat BRL cell Marker BRL cell B A 586bp 471bp Figure 2.
Marker BRL cell Rat Marker M D U C 601bp 201bp Figure 2.
208bp Marker E 480bp 381bp 330bp 457bp Figure 2.
A Figure 3.
B Figure 3.
120 y = 0.9661x + 2.6864 2 R = 0.9747 100 80 Observed methylation 60 40 n=12 20 0 0.0 20.0 40.0 60.0 80.0 100.0 Expected methylation Figure 4.