Download
1 / 19
190 likes | 393 Views
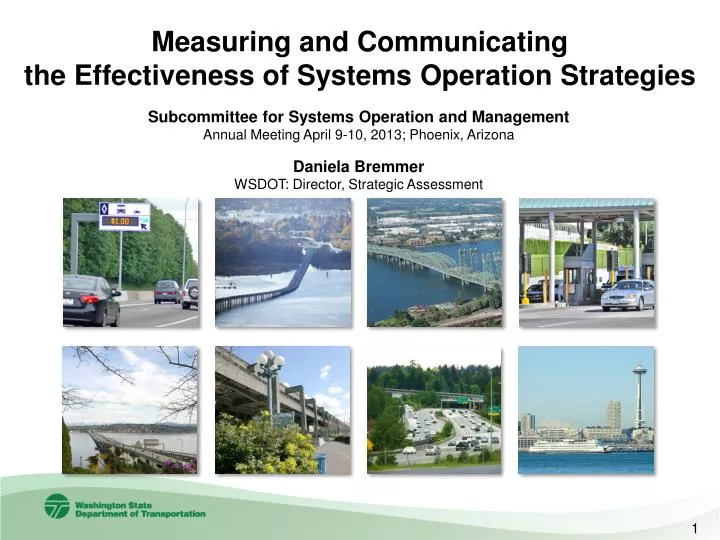
Measuring and Communicating the Effectiveness of Systems Operation Strategies. Subcommittee for Systems Operation and Management Annual Meeting April 9-10, 2013; Phoenix, Arizona. Daniela Bremmer WSDOT: Director, Strategic Assessment. 1.

E N D
Measuring and Communicating the Effectiveness of Systems Operation Strategies Subcommittee for Systems Operation and Management Annual Meeting April 9-10, 2013; Phoenix, Arizona Daniela Bremmer WSDOT: Director, Strategic Assessment 1
Building of a Brand: Moving Washington- WSDOT’s strategy to address congestion Improving the Performance of Our State’s Transportation Corridors by: 2
Operating Efficiently: Overview Getting the most out of the infrastructure we have • Intelligent Transportation Systems (ITS): • 155 ramp meters, 106 real-time traveler information, 746 traffic cameras, 258 variable message boards, 7 traffic management centers. • Incident Response Teams: • Statewide IR teams responded to 44,492 incidents in 2011. Average clearance time dropped from 33 minutes in 2001 to 12.6 minutes in 2011. • Signal Timing: • Signal optimization program monitors and adjusts up to 1000 traffic signals to save drivers thousands of hours in yearly traffic delay. • High occupancy vehicle (HOV) lanes: • WSDOT has completed 309 lane-miles of planned 320 lane-mile HOV system that is funded. • High occupancy toll (HOT) lanes: • Making HOV lanes more efficient. Traffic Management Center Incident Response Team SR 167 HOTlanes SR 167 HOT lanes 3
WSDOT’s Performance Management Philosophy for all Programs-including Operations 1. Communicate clear, relevant and easy-to-understand measures and results using Performance Journalism 2. Demonstrate how programs contribute to agency and state priorities 3. Monitor and analyze detailed program data 4. Evaluate effectiveness (Before and After) of deployed strategies 5. Hold regular problem-solving sessions –avoid silos 6. Allocate resources based on strategies that work-performance based investment decisions 7. Indentify and target key audience groups 8. Regularly report to governor, legislature, media and public on performance - seek and create opportunities to report Ask yourself- What operational metrics and data would convince you that your tax payer dollars are well spent? 4
Traffic Operations Performance Measurement Opportunities and Challenges-Examples • The Challenge of Operational Strategies to fill the Productivity Gap • Measuring System Productivity • The Challenge of Quantifying Operational Benefits • Traffic Incident Management (TIM) Example 6
Making a Case for Operational Strategies Measuring and Communicating Lost Throughput Productivity • WSDOT monitors vehicle throughput at strategic locations on the central Puget Sound freeway system using real-time data. • Throughput productivity is measured by the difference between the highest average five minute flow rate observed during the year and the flow rate that occurs when vehicles travel below the maximum throughput speeds (50 mph). 7
Making a Case for Operational Strategies Measuring and Communicating Lost Throughput Productivity • Lost throughput productivity measures the percentage of a highway’s vehicle throughput capacity that is lost due to congestion in terms of vehicles per lane per hour. 8
Articulating Economic Benefits of Operational Strategies New efforts for Operational Strategies: Traffic Incident Management (TIM) Example WSDOT Incident Response Team arrive quickly to assist with traffic control and clean up. September 22, 2011. 9
“Clearing Roads - Helping Drivers” Washington’s Incident Response (TIM) Program Key Performance Measures for Incident Response Teams* *WSDOT and WSP work together and track many more TIM measures, for details please see: Gray Notebook 48, pages 24-27, Gray Notebook 47, pages 17-19, Gray Notebook 46, pages 24-26(http://wsdot.wa.gov/publications/fulltext/graynotebook/Dec12.pdf) Source: WSDOT Strategic Assessment Office (http://www.wsdot.wa.gov/accountability/) 10
A “roadway clearance time” based metric: Over-90-minute Incident Analysis (WSDOT & WSP- GMAP) Based on WSDOT and WSP-Joint Operations Policy Statement (JOPS)”clear blocking traffic incidents in 90 minutes or less” http://www.wsdot.wa.gov/Operations/IncidentResponse/partnerships.htm Source: WSDOT (http://www.wsdot.wa.gov/accountability/) 11
An “incident clearance time” based metric (WITS data only): Average Incident Clearance Time (Scene is Clear – no responders remaining) (January 2001 – December 2011) Source: WSDOT Strategic Assessment Office (http://www.wsdot.wa.gov/accountability/) 12
Quantifying Benefits of the Incident Response Program Safety Traveler Experience Delay /Congestion Reduction Economic Benefits 13
Estimated Economic Benefits Delay Reduction - WITS data only • Baseline Assumptions: • Based on research performed by University of Maryland, Rice University, and Texas Transportation Institute incident-induced delay was reduced by about 25% on average when incident response personnel assisted with incident clear-up. • WSDOT Incident Response research (TRAC 761.1) suggests an average incident • with no lane closure costs $244 per minute of incident • with lane closure costs $345 per minute of lane closure • In 2012, Q2, WSDOT response teams helped clear 11,292 incidents statewide (This represents approximately 65% of all WSP-CAD records) • Economic benefits WSDOT’s Incident Response (IR) program responded to 11,292 incidents in the second quarter of 2012, saving travelers and businesses in Washington about $9.25 million by reducing the time and gas they would have wasted in travel delay due to congestion. Source: WSDOT Strategic Assessment Office (http://www.wsdot.wa.gov/accountability/) 14
Quarterly Analysis of Economic Benefits* of the TIM Program * The economic benefits for the TIM program are estimated as 25% of the cost of the incident induced delay. WSDOT’s program cost is $1.125 million per quarter. Source: WSDOT Strategic Assessment Office (http://www.wsdot.wa.gov/accountability/) 15
Estimated Benefits of “Secondary Crashes” Avoided*(WSDOT assumptions) • Baseline Assumption: based on national case studies, the average secondary crash rate can be estimated at 20% (or more) of the primary number of incidents (FHWA) • In Q2 2012, WSDOT response teams helped clear 11,292 incidents statewide (Approximately 65% of all WSP-CAD records) • These proactive response actions helped avoid 2,258 secondary crashes (11,292*0.2 ) from occurring in Q2 2012 • Economic benefits from secondary crashes avoided is $7.5 million (Assumptions include: Average clearance time for a secondary crash is 11.6 minutes and cost per minute of crash scene duration is $286; (2,258*11.6*$286 = $7.5M)) *Preliminary analysis in the 2012 Congestion Report; Source: WSDOT Strategic Assessment Office (http://www.wsdot.wa.gov/accountability/) 16
Combined Estimated Economic Benefits of the Incident Response Program Quarterly Delay reductions: $9.25 million Secondary Crashes avoided : $7.50 million Total estimated quarterly economic savings/benefits: $16.75 million Quarterly Cost of Incident Response Program (WSDOT): $1.13 million Benefit Cost Ratio is approximately: 15 to 1 17
New Opportunities-Measuring Benefits of Active Traffic Management and Tolling Strategies……stay tuned! Source: San Diego Union-Tribune, Dec. 15, 2010 18
Resources • Moving Washington Website: http://www.wsdot.wa.gov/movingwashington/ • WSDOT’s Congestion Website: http://www.wsdot.wa.gov/Congestion/ • WSDOT’s Accountability Website: http://www.wsdot.wa.gov/accountability/ • Real Time Travel Times Website: http://www.wsdot.wa.gov/traffic/seattle/traveltimes/ • Plan Your Commute– 95% Reliable Travel Times Website: http://www.wsdot.wa.gov/Traffic/Seattle/TravelTimes/reliability/ • WSDOT’s quarterly performance report: the Gray Notebook: http://www.wsdot.wa.gov/Accountability/GrayNotebook/navigateGNB.htm • Performance Measurement at WSDOT, four page foliohttp://www.wsdot.wa.gov/NR/rdonlyres/91089378-E709-49EF-AE42-AE80BC44A91C/0/TRB_Performance_Folio.pdf • WSDOT’s Strategic Plan: http://www.wsdot.wa.gov/Accountability/PerformanceReporting/StrategicPlan.htm • Performance Journalism: http://www.wsdot.wa.gov/NR/rdonlyres/685F6B37-9082-47DE-81FC-676EE95C5EE9/0/Bridging_Gap_PJ_TRBprintedvsn.pdf • Making the Case for Funding: The WSDOT Experience (2008, Transportation Research Record)http://www.wsdot.wa.gov/NR/rdonlyres/E5D34B36-6662-4464-B4BA-1E858BBD710D/0/2007_TRB_Making_Case_Funding.pdf • Maximizing Highway System Capacity: Measuring and Communicating System Performance in an Evolving Field–(2008, Transportation Research Forum) http://www.wsdot.wa.gov/NR/rdonlyres/5FF329ED-A840-4F8A-A798-468948BEE80B/0/Maximizing_Highway_Capacity_PM_finalvsn.pdf Daniela Bremmer Washington State Department of Transportation Director, Strategic Assessment Office 360-705-7953 BremmeD@wsdot.wa.gov Contact Info: 19