Download
1 / 13
130 likes | 204 Views
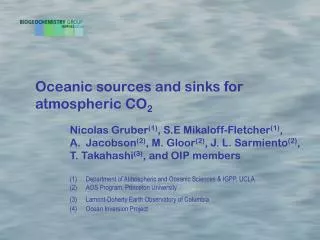
ICDC7 Broomfield, 25-30 September 2005. A direct carbon budgeting approach to study CO 2 sources and sinks. C. Crevoisier 1 E. Gloor 1 , J. Sarmiento 1 , L. Horowitz 2 , S. Malyshev 2 , E. Shevliakova 2 , C. Sweeney 3 , A. Andrews 3 , P. Tans 3. Introduction.

E N D
ICDC7 Broomfield, 25-30 September 2005 A direct carbon budgeting approach to study CO2 sources and sinks C. Crevoisier1 E. Gloor1, J. Sarmiento1, L. Horowitz2, S. Malyshev2, E. Shevliakova2, C. Sweeney3, A. Andrews3, P. Tans3
Introduction • Determining the location, the intensity and the evolution in time of the sink of carbon in the northern hemisphere remains one of the main issues in carbon cycle study. • Huge amount of measurements of CO2 by aircraft and tall towers will soon be available at many locations across the United States, in the framework of the North American Carbon Plan. • Aircraft measurements: • 19 sites + 3 new sites (2006). • Measurements up to 8 km once per week. • This should allow the design of new estimation methods, possibly avoiding the use of a priori information. Direct carbon budgeting approach and test of the network.
Direct carbon budgeting approach Let’s put a ‘box’ over the region where we want to estimate surface fluxes. Exchanges with the upper atmosphere (convection, advection) Carbon mass budget dC/dt = (Fhin-Fhout) - Fvertical+Fsurf h ? Out Observations aircrafts + towers. In surface CO2 fluxes Following the existing network, we chose: • box over the US + South Canada. • h=8km.
Simulations of atmospheric CO2 2 MOZART atmospheric transport/chemistry model 0 -2 -4 CO2 NCEP (2º2º, 29 levels) [Horowitz et al. 2003] monthly fossil fuel emissions air/sea fluxes air/land fluxes CASA model [Blasing et al. 2004] GFDL, J. Dunne [Randerson et al. 1997] From these simulations, we can compute each term of the carbon mass budget. (GtC.month-1) dC/dt = (Fhin-Fhout) - Fvertical+Fsurf Fsurf what we want to retrieve… dC/dt month
Horizontal Fluxes: Advection dC/dt = (Fhin-Fhout) - Fvertical + Fsurf Evolution of the horizontal fluxes along the edges of the box: income and outcome pathways. e.g.: November + Center: NCEP winds - Out In - In Out +
Horizontal Fluxes: Advection 2 0 Monthly variation (sum along the edges) -2 Fhin-Fhout -4 (GtC.month-1) Fsurf dC/dt month dC/dt = (Fhin-Fhout) - Fvertical + Fsurf Evolution of the horizontal fluxes along the edges of the box: income and outcome pathways. e.g.: November + Center: NCEP winds - In - Out
Vertical fluxes: convection (and advection) at h=8 km 2 0 -2 -4 dC/dt = (Fhin-Fhout) - Fvertical+ Fsurf Monthly variation convection Convection fluxes summer - h=8km (kgC.m-2.s-1) vertical advection Fhin-Fhout Fsurf dC/dt month
Vertical fluxes: convection (and advection) at h=8 km 2 0 -2 -4 dC/dt = (Fhin-Fhout) - Fvertical+ Fsurf Monthly variation convection Convection fluxes summer - h=8km (kgC.m-2.s-1) vertical advection Fhin-Fhout Fsurf dC/dt Monthly convection flux at different levels month 0 8 km At h=8 km, the vertical fluxes are small but the lower the altitude, the higher the convection flux. -0.2 5 km (GtC.month-1) -0.4 700m -0.6
Study of the Observation Network From CO2 simulated at 19 sites, we infer CO2 in the whole US. Use of a geostatistical interpolation technique: kriging.
Study of the Observation Network From CO2 simulated at 19 sites, we infer CO2 in the whole US. Use of a geostatistical interpolation technique: kriging. Monthly mean error on CO2 mixing ration (integrated content 0-8 km) (ppmv)
Example: Error in July The corresponding error on flux estimation is 19.3 %. Error on CO2 mixing ratio after interpolation Winds 1 (ppmv) 0 1.5 -1 Surface fluxes (kgC.m-2.yr-1) 0 -1.5
Network design A way to reduce the interpolation error: adding a few stations… e.g.: one more station in NW [55N;110W] Monthly error on CO2 mixing ratio - August Planned network + 1 station 1 1 (ppmv) 0 0 -1 -1 The error on flux estimation is reduced to 8.3 %.
Conclusions and perspectives • A direct budgeting approach seems possible with the high density measurements … at least on simulations! • With a few more stations in NW and SW, we should be able to have an accurate description of CO2 in the US. • Extending the method to higher spatial (0.5°) and temporal (hourly) resolutions. • Estimation of the errors (interpolation, convection, etc). • The main target is the convection. Some ways to estimate it: • Using other tracers (O3, APO~O2+1.1xCO2, SF6, others?). • CO2 from satellite (measurements in the mid to high troposphere) to fix the top of the box. • Applying the method in restricted regions where no convection. • Estimated surface fluxes = biospheric fluxes + fossil fuel emissions. use of other tracers to separate both contribution (14CO2).