Download
1 / 14
140 likes | 255 Views
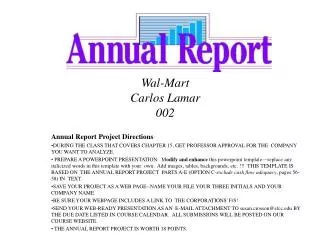
Kwan Lun ACG2021 Section 080 NIKE, Inc. Annual Report Project Directions : DURING THE CLASS THAT COVERS CHAPTER 15, GET PROFESSOR APPROVAL FOR THE COMPANY YOU WANT TO ANALYZE.

E N D
Kwan LunACG2021 Section 080 NIKE, Inc. • Annual Report Project Directions: • DURING THE CLASS THAT COVERS CHAPTER 15, GET PROFESSOR APPROVAL FOR THE COMPANY YOU WANT TO ANALYZE. • PREPARE A POWERPOINT PRESENTATION: Modify and enhance this powerpoint template—replace any italicized words in this template with your own. Add images, tables, backgrounds, etc. !!! THIS TEMPLATE IS BASED ON THE ANNUAL REPORT PROJECT PARTS A-E (OPTION C-exclude cash flow adequacy, pages 56-58) IN TEXT. • SAVE YOUR PROJECT AS A WEB PAGE--NAME YOUR FILE YOUR THREE INITIALS AND YOUR COMPANY NAME. • BE SURE YOUR WEBPAGE INCLUDES A LINK TO THE CORPORATIONS' F/S! • SEND YOUR WEB-READY PRESENTATION AS AN E-MAIL ATTACHMENT TO susan.crosson@sfcc.edu BY THE DUE DATE LISTED IN COURSE CALENDAR. ALL SUBMISSIONS WILL BE POSTED ON OUR COURSE WEBSITE. • THE ANNUAL REPORT PROJECT IS WORTH 18 POINTS.
Executive Summary After completing this analysis, I can a sure that Nike has a bright future ahead. With the expanding range of products and research and development into their equipments, it can only benefit their quality of goods. Their financial statements will attract many investors to join their company. With the stock prices going up and the dividends pay out increasing, there is no stopping to what Nike can do. But I believe since Nike have touched every part of sports in different ways, they still need to have a Nike food and beverage department. Protein bars and energy drinks, it’s only time till they actually come up with these products. http://www.nike.com/nikebiz/nikebiz.jhtml?page=18
Part A. Introduction • The name of nike’s chief executive officer is Philip H. Knight. • The location of home office is Beaverton, Oregon. • The ending date of latest fiscal year was August 31, 2004 • Description of the principal products or services that the company provides: Nikes’s products started as sport footwear. As it grew larger it took on making other products like clothing, sports equipment, accessory, and electronics. It also became one of the world’s largest seller of athletic products. • Main geographic area of activity: Nike is an international corporation. Their products are marketed in nearly 200 countries Outside of the U.S.. The company operates through 24 distribution centers in Europe, Asia, Australia, Latin America, Africa, and Canada. Nike has 175 retail outlets outside the U.S. and it is estimated that more than 30,000 of it’s retail accounts are foreign.
Part A. Audit Report • The name of the company’s independent auditors is Pricewaterhouse C oo LLP. • In your own words, what did the auditors say about the company According to what the auditor said, 2004 was the best year they have had. They crossed $12 billion in revenue, a 15 percent increase over last year, with 27 percent growth in earnings per share. In fiscal '04, Their international pre-tax profits grew by nearly a third. With Cole Haan, Bauer Nike Hockey, Converse and ,Hurley, all these are companies they own, are now making over a billiob dollars in revenue. He also concluded that there is lots of room to grow.
Part A. Stock Market Information • The most recent price of the company’s stock was $81.11 • Last Twelve month trading range of Nike. $60.69- $81.80 • Dividends per share: $ .80 • Date of above information: October 29, 2004 • My opinion about Nike’s stock is definitely to keep it. There are slight dips in stock but the overall outcome is that it gains money.
Part B. Industry Situation and Company Plans Nike is definitely expanding. From buying out long time company Converse to owning Hurley. There must be an expansion and investment from Nike as years to come. With the stock price rising it only shows there will be a bright future for Nike.
Part C. Income Statement • The format is most like a Multistep. • Gross Profit increases due to an increase in sale • Net Inc. operation increases. • Net income increased from 2003 to 2004. * (Charts in millions)
Part C. Balance Sheet Comments • Assets increased by 1047.2 • Liabilities decreased by 73.8 • Owner’s Equity increased by 1121 * (Charts in millions)
Part C. Statement of Cash Flow • Cash flow from operations is more than net income for the past two years. • Nike is definitely increasing their investments from 42.3 million in 2003 to 72.4 million in 2004. • Nike’s primary source of financing is stock sales. • Overall, cash increased over the past two years.
Significant Accounting Policies: Basis of Consolidation Shipping & Handling Cost Inventory Valuation Stock Based Compensation Recognition of Revenues Cash & Equivalents Prop., Plant, & Equipment & Dep. Earning Per Share Topics of Note to Financial Statement: Summary of Significant Acc. Policies Inventories Property, Plant, & Equipment Identifiable Assets & Liabilities Accrued Liabilities Short Term Borrowing and Credit Lines Long Term Debt Income Tax Redeemable Preferred Stock Common Stock Earning per Share Benefit Plans Interest Income Comprehensive Income Commitments & Contingencies Risk Management & Derivatives Operating Segments & Related Info Subsequent Event Part D. Accounting Policies
Part E. Financial Analysis Liquidity Ratios * ( Charts in millions)
Part E. Financial Analysis Solvency Ratio For the past two years, calculate and comment on: • Debt to Equity • There is little difference in Debt to Equity in 2004 and 2003
Part E. Financial Analysis Market Strength Ratios For he past two years calculate and comment on: • Price/ earning per share • Dividend yield