Download

1 / 7
80 likes | 265 Views
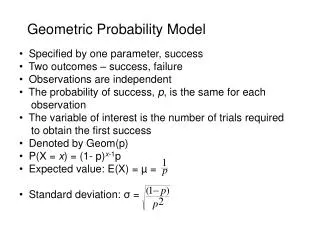
Geometric Probability Model. Specified by one parameter, success Two outcomes – success, failure Observations are independent The probability of success, p , is the same for each observation The variable of interest is the number of trials required

E N D
Geometric Probability Model • Specified by one parameter, success • Two outcomes – success, failure • Observations are independent • The probability of success, p, is the same for each • observation • The variable of interest is the number of trials required • to obtain the first success • Denoted by Geom(p) • P(X = x) = (1- p)x-1p • Expected value: E(X) = µ = • Standard deviation: σ =
Example: Postini, a global company specializing in communications security, reported that 91% of e-mails are spam. Assume your e-mail is typical – 91% spam. Assume you’re not using a spam filter so all spam is dumped in your inbox. Since spam comes from many different sources, we’ll consider the messages independent. Overnight your inbox collects mail. When you check your e-mails in the morning about how many spam e-mails should you expect before you find a real message? What is the probability that the 4th message in your inbox is the first one that isn’t spam?
1: There are 2 outcomes – real message (success), spam (failure) The probability of success is p = 1 – 0.91 = 0.09 2: Let X = the number of e-mails checked before a real message. 3: Assuming the messages arrive independently and are in random order I can use Geom(0.09)
On average I expect to check just over 11 e-mails before the real message. P(X=4) = (0.91)3(0.09) = 0.0678 There's slightly less than a 7% chance that my first real message will be the 4th one I check.
Do Now: People with O-negative blood are called “universal donors” because O-negative blood can be given to anyone else, regardless of the recipient’s blood type. Only about 6% of people have O-negative blood. If donors line up at random for a blood drive, how many do you expect to examine before you find someone who has O-negative blood? What’s the probability that the first O-negative donor found is one of the first four people in line?
Solution Blood drives such as this one expect to examine an average of 16.7 people to find a universal donor. P(X ≤ 4) = P(X = 1) + P(X = 2) + P(X = 3) + P(X = 4) P(X ≤ 4) = (0.06) + (0.94)(0.06) + (0.94)2(0.06) + (0.94)3(0.06) P(X ≤ 4) ≈ 0.2193 About 22% of the time, there will be one within the first 4 people in line.
Calculator functions: Geometpdf(p,x): Finds the probability of any individual outcome. x indicates the number of trials until you get a success. Geometcdf(p,x): Finds the probability of finding the first success on or before the xth trial.