Download
1 / 24
240 likes | 372 Views
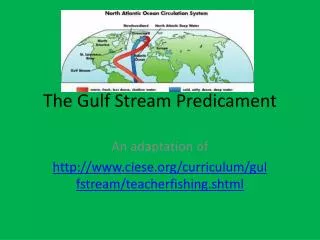
Longitudinally Oriented Cloud Systems Associated With The Gulf Stream Off The Florida East Coast Wanda Reeves Department of Marine Environmental Systems Florida Institute of Technology Melbourne, Fl 32901. Weather.msfc.nasa.gov. Theories for Longitudinally Oriented Cloud Systems.

E N D
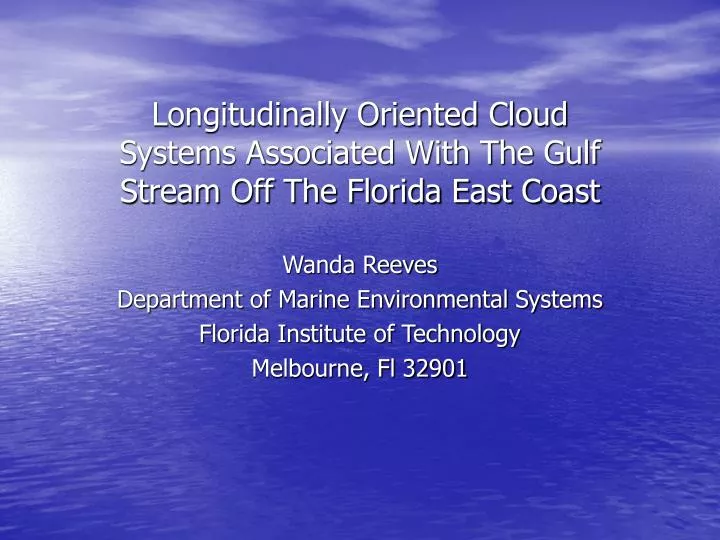
Longitudinally Oriented Cloud Systems Associated With The Gulf Stream Off The Florida East Coast Wanda Reeves Department of Marine Environmental Systems Florida Institute of Technology Melbourne, Fl 32901
Theories for Longitudinally Oriented Cloud Systems • Two theories have been proposed to explain circulations that generate these cloud systems in the Gulf Stream region. -Solenoid Theory -Marine Atmospheric Boundary Layer (MABL) Theory
Solenoid Theory • A theory in which winds are driven by the thermal/density differences between air masses. The cold, dense air sinks and the warm, less dense air rises creating a circulation that forms solenoids.
Solenoid Theory More Dense Air More Dense Air Less Dense Air High High Low Cool Shelf Water Warm Gulf Stream Water Cool Atlantic Water
Solenoid Theory N E W S More Dense Air Less Dense Air More Dense Air B A Cool Shelf Water Gulf Stream Water Cool Atlantic Water When the wind is from the east, convection is expected to be located at the “frontal zone” labeled A and when the wind is from the west, convection is expected to be located along a “frontal zone” at point B.
Marine Atmospheric Boundary Layer Theory A theory that is based upon Sea Surface Temperature Gradients and that winds are proportional to temperatures near the surface.
Illustration, from “Satellite Measurements Reveal Persistent Small-Scale Features in Ocean Winds” article, of how the wind varies in the Marine Atmospheric Boundary Layer 300 200 Height (m) Cool and Stabilized 100 Warm and Destabilized 0 5 10 Wind Speed (m/s) www.sciencemag.org Authors: Dudley B. Chelton, Michael G. Schlax, Michael H. Freilich, Ralph F. Milliff
Schematic diagram, from research article “Satellite Measurements Reveal Persistent Small-Scale Features in Ocean Winds”, of divergence and curl of the wind stress (tao) resultiing from spatial variations of the sst effects on the surface winds Cool Divergence Positive Vorticity Divergence/Convergence needs winds to be parallel to the temperature gradient Warm
Marine Atmospheric Boundary Layer Divergence Convergence Cool Shelf Water Warm Gulf Stream Cool Atlantic Water Easterly Flow
Marine Atmospheric Boundary Layer Divergence Cool Shelf Water Warm Gulf Stream Cool Atlantic Water Westerly Flow
Convection along the west edge of Gulf Stream on April 21,2005 (1556 UT) NOAA-17 AVHRR Water Surface Temperature Image Courtesy of Ocean Remote Sensing Group, Johns Hopkins University Applied Physics Laboratory
Convection along the west edge of the Gulf Stream on June 8, 2005 Johns Hopkins University Applied Physics Laboratory
Convection along the east side and middle of the Gulf Stream on May 15, 2005 (2015 UT) Johns Hopkins University Applied Physics Laboratory
Convection in the middle of the Gulf Stream on May 12, 2005 (1135 UT) Johns Hopkins University Applied Physics Laboratory
An example of convection that meanders along and through the Gulf Stream on May 2, 2005 (2330 UT) Johns Hopkins University Applied Physics Laboratory
925 mb upper atmosphere chart for June 8, 2005. Spc.noaa.gov/
An example of Ship and Buoy Data Observations used in the convective clouds determination process.
This is a GOES West Satellite Composite Infrared Image for June 8, 2005. SFSU.edu
This scatterometer picture for June 8, 2005 shows convergence where the winds shift from a Southeast direction at 10 knots to East at 5 knots. This gives an indication of convergence of the wind.
This is the same Scatterometer Image but with Convergence and Divergence calculated.
West Side of Gulf Stream N NE E SE S SW W NW April 5 June 8 June 16 June 13 April 21 April22 April 28 Middle of Gulf Stream N NE E SE S SW W NW April 22 June 8 May 15 May 12 April 5 April 28 May 7 June 26 May 17 East Side of Gulf Stream N NE E SE S SW W NW April 21 June 26 May 15
Questions? Ryan Brown