Download

1 / 60
620 likes | 805 Views
PBL Business Case Analysis. Defense Acquisition University. A premier corporate university serving DoD Acquisition, Technology, and Logistics. Jerry Cothran, Program Director PBL DAU – Capital NE. Agenda. BCA Model Content Development PBL BCA Specifics PBL BCA Summary and Conclusions

E N D
PBL Business Case Analysis Defense Acquisition University A premier corporate university serving DoD Acquisition, Technology, and Logistics Jerry Cothran, Program Director PBL DAU – Capital NE
Agenda • BCA Model • Content • Development • PBL BCA Specifics • PBL BCA Summary and Conclusions • References
What is a BCA ? • Until recently, BCA was not a common term in DoD - but routine in the business world. • In DoD, we usually do: “economic analysis; cost/benefit analysis; cost of ownership analysis; analysis of alternatives” • A BCA is an extended form of cost/benefit analysis that assesses: • An alternatives’ total costs for satisfying a business need weighed against the alternatives’ total benefits to determine an optimum solution • BUT ALSO ADDRESSES qualitative andsubjective factorsdirectly impacting the decision-making process, along with risk and sensitivity analysis
What is a BCA ? • The output of a BCA is an analysis of viable alternative business strategies, along with recommendations for proceeding with the best value alternative • HOWEVER…DoD is BUDGET-DRIVEN, so if it doesn’t make sense from a cost perspective, it’s going to be a hard sell
Why Create a Business Case ? Well, because we have to… • 1999 NDAA section 346 • DoD must notify Congress if a “Prime Vendor” contract that includes depot level maintenance or repair on a weapon system is pursued; requires an “analysis of costs and benefits” • USD/ATL 23 Jan 2004 Memo • BCAs to be used to “assess changes from existing support strategies for legacy systems and to support the product support strategy for new weapon systems” • 2004 Strategic Programming Guidance • Requires the Services to complete a BCA by 30 Sep 06 on all Fielded ACAT I and II programs for application of PBL
And Because We Need To… • The focus is on achievement of a ‘best value’ support strategy • To achieve best value, we need to assess many factors regarding where, how, and by whom workload can best be accomplished • Those factors fall into three primary categories • Statutory: Title 10 U.S.C. • Policy: OSD and Service policy
The BCA serves as a critical decision tool in arriving at the best value answer with a complex, comprehensive range of mandatory, desired, and other criteria And Because We Need To… • And… • Best Value: Best use of public/private sector capabilities considering: • Existing support infrastructure, skills base, and capacity • Competencies and constraints • Uniqueness and/or commonality of workloads • Life cycle phase • Operational mission • and others…
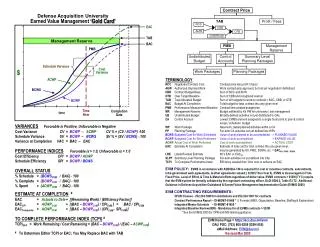
A considered analysis of those Alternatives The Recommended Alternative – and WHY Where you are now Your Alternatives for where you want to be OK, So How Do I Prepare a BCA? • Establish Scope, Baseline, Alternatives, and Assumptions • Complete Cost Estimates • Conduct Sensitivity Analysis • Accomplish Risk Assessments • Analyze Business Impacts • Conclusion and Recommendations
Steering Committee and/or Stakeholders DLA Inventory Manager Program Manager Counsel PBL IPT Business Case Project Officer Contracting Officer Logistics Manager Cost Analyst Engineer Customers FMS Customers Govt Repair Depot Supplier Technical Analyst Financial/Budget Analyst Process SME Comptroller “It Takes a Village…” OK…a TEAM BCA
BCA Structure • Introduction • - Identify Subject, Purpose, Scope, Baseline, Alternatives, and Objectives of the BCA • Methods and Assumptions • - Specify analysis methods and rationale (what costs, what estimating methods, and whose • benefits) • - Specify Ground Rules and Assumptions (GR&A) • - - List filtering criteria (Statutory; Policy): “No or Few Option Constraints”; Title 10, etc. • C.Business Impacts: Analysis/comparison of alternative solutions against baseline • -Define current baseline (as basis for comparison of alternatives) • - Cost estimates: Analysis of baseline vs. alternatives in COST terms • - Non-financial analysis: Analysis of all non-financial factors; baseline vs. alternatives) • D.Sensitivity and Risks • - Identify Risk Categories, Risk Metrics, and Risk Level with rationale • - Conduct Sensitivity Analysis: how results depend on, or react to changes in, important • assumptions (“what if”) • - Risk Assessment: For each risk category, assign risk metric (low, medium, high), with rationale • E.Conclusions and Recommendations • Recommend specific actions based on business objectives and the results of the analysis.
Sample BCA Format Executive Summary Introduction/Overview Subject, Purpose, Scope, Baseline, and Objectives Background Organization Major Assumptions and Constraints Financial Metrics Used and Defined Analysis Methodology The Cost and Benefit Model Used (Explanation of Cost Types and Categories) Description of Baseline Description of Alternatives Costs and Benefits Over Time Financial Analysis Non-quantitative Factors, Criteria, and Rationale for Their Use Comparison of Alternatives (quantitative and qualitative) Sensitivity Analysis Risk Analysis Conclusions and Recommendations Results Rationale Scenarios and POA&M for Implementation Strategy and Tactics to Optimize Results Introduction Methods and Assumptions Business Impacts Sensitivity and Risks Conclusions & Recommendations From: “The Business Case Guide”; by Dr. Marty J. Schmidt, Solution Matrix, Ltd; 2002
Building the BCA (continued) The best executive summaries contain the whole case in miniature (be BRIEF!): - subject, purpose, scope, baseline summary - important objectives addressed - key financial results - significant non-financial impacts - major assumptions that control results - sensitivity and risk considerations - conclusion and recommendations All conveyed succinctly - It should not be more than 1 - 2 pages - It comes first in the BCA, but is written last. Executive Summary Introduction/Overview Subject, Purpose, Scope and Objectives Background Organization Major Assumptions and Constraints Financial Metrics Used and Defined Analysis Methodology The Cost and Benefit Model Used (Explanation of Cost Types and Categories) Description of Alternatives Costs and Benefits Over Time Financial Analysis Non-quantitative Factors, Criteria, and Rationale for Their Use Comparison of Alternatives (quantitative and qualitative) Sensitivity Analysis Risk Analysis Conclusions and Recommendations Results Rationale Choice of Scenarios for Implementation Strategy and Tactics to Optimize Results Plays a key role in the way recipients judge a case. - It deserves careful writing - some recipients will only read the executive summary.
Executive Summary Introduction/Overview Subject, Purpose, Scope and Objectives Background Organization Major Assumptions and Constraints Financial Metrics Used and Defined Analysis Methodology The Cost and Benefit Model Used (Explanation of Cost Types and Categories) Description of Alternatives Costs and Benefits Over Time Financial Analysis Non-quantitative Factors, Criteria, and Rationale for Their Use Comparison of Alternatives (quantitative and qualitative) Sensitivity Analysis Risk Analysis Conclusions and Recommendations Results Rationale Choice of Scenarios for Implementation Strategy and Tactics to Optimize Results Building the BCA (continued) Subject: Every case needs an explicitsubject statement describing what the case is about. it helps shape or define everything else in the case. Purpose: The reader must know specifically what the case will be used for; how it will be used; and who (agency) it’s being done for. Baseline Summary: What is your starting point? Summarizing the baseline provides a point of reference for the reader. Objectivesdescribe the desired end state - regardless if the status quo remains, or is replaced by another alternative - Objectives are the reason for considering a decision in the first place.
Executive Summary Introduction/Overview Subject, Purpose, Scope and Objectives Background Organization Major Assumptions and Constraints Financial Metrics Used and Defined Analysis Methodology The Cost and Benefit Model Used (Explanation of Cost Types and Categories) Description of Alternatives Costs and Benefits Over Time Financial Analysis Non-quantitative Factors, Criteria, and Rationale for Their Use Comparison of Alternatives (quantitative and qualitative) Sensitivity Analysis Risk Analysis Conclusions and Recommendations Results Rationale Choice of Scenarios for Implementation Strategy and Tactics to Optimize Results Executive Summary Introduction/Overview Subject, Purpose, Scope and Objectives Background Organization Major Assumptions and Constraints Financial Metrics Used and Defined Analysis Methodology The Cost and Benefit Model Used (Explanation of Cost Types and Categories) Description of Alternatives Costs and Benefits Over Time Financial Analysis Non-quantitative Factors, Criteria, and Rationale for Their Use Comparison of Alternatives (quantitative and qualitative) Sensitivity Analysis Risk Analysis Conclusions and Recommendations Results Rationale Choice of Scenarios for Implementation Strategy and Tactics to Optimize Results Building the BCA (continued) • Assumptions • - Not everything is “known”; there will always be • “assumptions” • About future events, costs, other info • - Assumptions predict, simplify or clarify • - Often termed “Ground Rules and Assumptions” • (GR&A), they lay the foundation for • WHERE you have made assumptions • WHY you made assumptions • the BASIS for your assumptions • - Must be acceptable to a ‘reasonable’ reader • Self-evident • Logically sound • Based on accepted models or methods • Intuitively make sense • Examples • Financial (budget, growth) • Operational (OPTEMPO) • Contract (term)
Executive Summary Introduction/Overview Subject, Purpose, Scope and Objectives Background Organization Major Assumptions and Constraints Financial Metrics Used and Defined Analysis Methodology The Cost and Benefit Model Used (Explanation of Cost Types and Categories) Description of Alternatives Costs and Benefits Over Time Financial Analysis Non-quantitative Factors, Criteria, and Rationale for Their Use Comparison of Alternatives (quantitative and qualitative) Sensitivity Analysis Risk Analysis Conclusions and Recommendations Results Rationale Choice of Scenarios for Implementation Strategy and Tactics to Optimize Results Building the BCA (continued) • Financial metrics used and defined • Net Present Value (NPV) • Benefit/Cost Ratio • Payback Period • Break Even Point • Return on Investment (ROI) • Internal Rate of Return (IRR) • Total Cost of Ownership (TOC) • Time Value of Money Considerations: • =Current or constant dollars (base year) • =Discounted dollars There are universally accepted methods of how financial data should be represented – they ensure clarity and understanding of your analysis
Executive Summary Introduction/Overview Subject, Purpose, Scope and Objectives Background Organization Major Assumptions and Constraints Financial Metrics Used and Defined Analysis Methodology The Cost and Benefit Model Used (Explanation of Cost Types and Categories) Description of Alternatives Costs and Benefits Over Time Financial Analysis Non-quantitative Factors, Criteria, and Rationale for Their Use Comparison of Alternatives (quantitative and qualitative) Sensitivity Analysis Risk Analysis Conclusions and Recommendations Results Rationale Choice of Scenarios for Implementation Strategy and Tactics to Optimize Results FY02 FY03 FY04 FY05 Direct Costs Indirect Costs G & A Other Direct Costs FY04 R & D Procurement O & S Disposal Hardware Software Personnel Facilities Building the BCA (continued) • What type of cost/benefit model is used? • - it describes how to read the spreadsheet, not • necessarily the spreadsheet itself • Assures the case includes all relevant line items, and only relevant line items • An organized list of cost and/or benefit items, usually arranged in cells • TAILORED to the scope and purpose of the BCA (e.g. will DIFFER from BCA to BCA)
Valuable Resource!! OSD CAIG O&S Cost Estimating Guide http://dcarc.pae.osd.mil/osd_ces/index.html “Predictions are always difficult – especially when they’re about the future” Niels Bohr Fundamentals of Cost Estimating Approximating the probable worth of an activity based on information available at the time
Estimating Types • Parametric, or “Top Down” • Most suitable in early stages of system development when information is not readily available – useful for ROM estimates • Relies on a Cost Estimating Relationship (CER) • Example: Cost per Flight Hour of similar or predecessor system • Multiplied by expected Flight Hours of new/replacement system • Other CERs (notional): Cost Per Pound, Cost Per Mile, etc.
Estimating Types, cont. • Estimating by Analogy • Costs of a similar system are used as a starting point… • Then adjusted for differences between the two systems • A good starting baseline must exist • Bottom Up Estimating • Uses a building block approach • Used when there is extensive data about the system • Much information is needed; not useful early in the program life-cycle • The BEST choice if sufficient data is available
Cost Estimating Quiz • Your uncle has a 2003 Jeep Wrangler 2WD, 4 cylinder, with a complete history of maintenance costs • You are considering buying a new 2005 Jeep Wrangler 4WD, 6 cylinder, and want to estimate your annual maintenance costs • What Estimating Method would you use – Parametric, Analogy, or Bottom Up? Why?
Cost Estimate Objectives • Your objective is to compare “Apples with Apples”,not “Apples with Oranges” • HOWEVER, you will inevitably have options with different cost timelines • In order to do an accurate cost comparison, you must: • ‘Normalize’ data in both categoryandrepresentation • Categories • To normalize across categories, accomplish a comprehensive Work Breakdown Structure (aka Estimating Breakdown Structure) • the EBS identifies all pertinent categories in which cost or non-cost assessments will be made • Representation • To normalize in terms of representation, you must convert dissimilar values to“Constant Year Dollars”
Estimating Breakdown Structure • Identify discrete functional cost elements, e.g. • Personnel • Training • Maintenance • Supply • Non-recurring costs • Etc. • The objective is to identify elements that: • Have clearly identifiable and available associated costs • Are common among all alternatives
Normalizing Cost Data • Use Constant Year Dollars • Constant Year Dollars are simply raw cost data adjusted for the effects of inflation • You first select a BASE YEAR (e.g. $CY05). All OTHER YEAR cost values will be adjusted to be equivalent to this base year by applying INFLATION indices – in other words, they well be DEFLATED. • Example: Your cost data reflects $100 in CY05 and $105 in CY07 • Your inflation indices reflect an inflation factor of 5% for CY07 • You would DEFLATE the CY07 amount of $105 by 5% • Resulting in a CONSTANT DOLLAR value of $100!
Converting Current Dollars to Constant Dollars FY05FY06FY07FY08 Current $ $100 $103 $105 $112 Inflation Indices 0% 4% 5% 7% $100 $99 $100 $104 Constant $
Normalizing Cost Data - NPV • Now that you have “Apples to Apples” cost data, you must compare the true cost benefits of differing alternatives • Compare Costs of Alternatives using Net Present Value (NPV) calculations • A dollar today is worth more than a dollar in the future – why? • Because: 1) The current dollar value is CERTAIN - not an estimate or forecast, and 2) I can INVEST today’s dollar • Net Present Value • The value of future earnings in “today's money” • Calculated by applying a discount rate % to future earnings • The further out the earnings are (in years) the more reduced the net present value (future year $$ have less value than Current $$) • NPV allows you to consider the relative time difference benefits ofROI and cash flow, allowing you to identifywhich alternative is “TRULY” LEAST COST
Dynamics of Present Value For a Discount Rate of 10% System A Present Value System A Net Cash Flow System B Net Cash Flow System B Present Value Period ($100) ($100) ($100) ($100) Now Year 1 $54.54 $20 $18.18 $60 $49.59 $20 $16.52 Year 2 $60 $30.05 $40 $30.05 $40 Year 3 $20 $13.70 $60 $41.10 Year 4 $20 $12.42 $60 $37.27 Year 5 +$100 +$100 Total NPV = +$60.30 NPV = +$43.12 Present Value = (Future Value) Present Value = (Future Value) n Year 1 1.0 + Int. Rate (0.1) Year 3 (1.0 + Int. Rate) 1.1 (1.1) 3 Higher ROI Earlier!
Assessing Objective and Subjective Criteria Against Alternatives
Making Subjective Assessments • The future is uncertain; Even ‘quantifiable’ values (i.e. costs) are subject to ‘educated guesses’ • In addition, other objective data is open to subjective assessments • Risk (Likelihood of an event happening; Degree of impact if it does happen) • Sensitivity (WHAT IF assumptions change?) • How can we make SUBJECTIVE assessments more OBJECTIVE?
Making Subjective Assessments The PROCESS… • Select your evaluation CRITERIA first • Weight (prioritize) your criteria • Assess each criteria against each ALTERNATIVE • Assess QUALITATIVE (Subjective) assessments in OBJECTIVE terms
Sample Weighted Comparison (set-up) Step Criteria 1 Weights CRITERIA Ease of Implementation Availability Rate Cost Savings Alternatives Results 60% of decision 15% of decision 25% of decision TheBaselineis 100%in effect now The Baseline delivers a65% availability rate The Baseline saves0$ Baseline 90% 80% $9.9M Alternative 1 80% 90% $21.7M Alternative 2 90% $30.4M 40% Alternative 3 100+90+80+40= 310 Sub-Totals 325 $62 M Add the columns
Sample Weighted Comparison (normalize) Step 2 CRITERIA Ease of Implementation Availability Rate Cost Savings Alternatives Results 25% of decision 60% of decision 15% of decision 100% 65% 0$ Baseline 100/310(.25)=.081 65/325(.6)=.12 0/62(.15)=0 80% $9.9M 90% Alternative 1 90/310(.25)=.073 80/325(.6)=.148 9.9/62(.15)=.024 80% 90% $21.7M Alternative 2 80/310(.25)=.064 90/325(.6)=.166 21.7/62(.15)=.052 90% $30.4M 40% Alternative 3 40/310(.25)=.032 90/325(.6)=.166 30.4/62(.15)=.074 Sub-Totals 310 325 $62 M divide first value by subtotal times weight
Sample Weighted Comparison (results) Step 3 CRITERIA Ease of Implementation Availability Rate Cost Savings Alternatives Results 60% of decision 25% of decision 15% of decision 100% 65% 0$ Baseline 100/310(.25)=.081 65/325(.6)=.12 0/62(.15)=0 .081+.12+0= .201 80% $9.9M 90% Alternative 1 90/310(.25)=.073 80/325(.6)=.148 9.9/62(.15)=.024 .245 .073+.148+.024= 80% 90% $21.7M Alternative 2 80/310(.25)=.064 90/325(.6)=.166 21.7/62(.15)=.052 .282 .064+.166+.052= 90% $30.4M 40% Alternative 3 40/310(.25)=.032 90/325(.6)=.166 30.4/62(.15)=.074 .272 .032+.166+.074= Sub-Totals 310 325 $62 M Add row column totals = Results
Prioritization Matrices:Pairwise Comparison • Criteria can be objective (i.e. ‘cost’) or subjective (i.e. ‘past performance’) • Each member ranks importance of each criteria • - Lowest ranked criteria is given value of “1” • - Next lowest criteria given a value of “2” etc • Average rankings derive the weighting factor results
Evaluate Options Option Comparison Scale • Used to evaluate 2 alternatives (for which weighting values have already been assigned) • A relative assessment of EACH CRITERIA against EACH OPTION is accomplished • Values are assigned per this SCALE to reflect the assessment of EACH OPTION vs. EACH CRITERA • THIS IS CALLED “Pair Wise Comparison”
CRITERIA CRITERIA WEIGHTING PAIR WISE COMPARISON FINAL RESULTS AND SCORES Winner! Option Selection Example
Prioritization Matrices (> 2 criteria) Step 1: Ranking the Criteria COLUMN Row Total Cost Savings Availability Rate criteria Ease of Implementation (% of grand total) criteria (.07) Ease of Implementation 1.2 1/5 1 R O W Reciprocal Availability Rate 5 10 15 (.87) Cost Savings 1/10 1.1 (.06) 1 Column Total .3 11 17.3 6 Row More Important Column More Important 1/5 = significantly less important 1/10 = exceedingly less important 1 = equally important 5 = significantly more important 10 = exceedingly more important 15 / 17.3 = .87
Prioritization Matrices (cont) Step 2: Ranking Options by Each Criteria EASE OF IMPLEMENTATION Row Totals (% of Grand Total) option Partnering CLS Baseline BPR option (.55) 20 5 10 5 Baseline 5 5 (.28) 1/5 10.2 BPR Partnering 1/5 (.02) 1/10 1/5 .5 (.15) 5.4 CLS 1/5 5 1/5 Column Total 36.1 20 10.2 .5 5.4 Row More Important Column More Important 1 = equal ease 5 = significantly more ease 10 = exceedingly more ease 1/5 = much less ease 1/10 = significantly less ease
Prioritization Matrices (cont) Step 2: Ranking Options by Each Criteria (cont) AVAILABILTY Row Totals (% of Grand Total) option Partnering CLS Baseline BPR option 1/5 1/10 1/5 (.01) .5 Baseline (.16) 1/10 5 1 6.1 BPR 5 Partnering (.66) 10 10 25 (.17) 5 1 1/5 6.2 CLS Column Total 6.2 .4 11.2 37.8 20 1 = equal availability 5 = significantly more availability 10 = exceedingly more availability 1/5 = much less availability 1/10 = significantly less availability
Prioritization Matrices (cont) Step 2: Ranking Options by Each Criteria (cont) COST SAVINGS Row Totals (% of Grand Total) option Partnering CLS Baseline BPR option (.03) 1.3 1 1/5 1/10 Baseline (.03) 1/5 1/10 1.3 BPR 1 (.28) Partnering 5 5 1/5 10.2 (.66) 25 CLS 10 10 5 Column Total .4 37.8 16 5.4 16 1 = equal cost savings 5 = significantly more cost savings 10 = exceedingly more cost savings 1/5 = much less cost savings 1/10 = significantly less cost savings
Prioritization Matrices (cont) Step 3: Ranking Options by All Criteria Criteria Weight Criteria vs. Option Row Totals (% of Grand Total) Ease of Implementation Availability Rate Cost Savings criteria option (.55) X (.07) (.01) X (.87) (.06) (.03) X .049 Baseline .0385 .0087 .0018 (.28) X (.07) (.87) (.06) (.16) X (.03 X BPR .1606 .1392 .0196 .0018 (.02) X (.07) (.87) (.06) THE WINNER ! (.66) X (.28) X Partnering .5924 .0014 .5742 .0168 (.15) X (.07) (.87) (.06) (.17) X (.66) X .198 CLS .0105 .1479 .0396 Column Total 1.00 .07 .87 .06
Executive Summary Introduction/Overview Subject, Purpose, Scope and Objectives Background Organization Major Assumptions and Constraints Financial Metrics Used and Defined Analysis Methodology The Cost and Benefit Model Used (Explanation of Cost Types and Categories) Description of Alternatives Costs and Benefits Over Time Financial Analysis Non-quantitative Factors, Criteria, and Rationale for Their Use Comparison of Alternatives (quantitative and qualitative) Sensitivity Analysis Risk Analysis Conclusions and Recommendations Results Rationale Choice of Scenarios for Implementation Strategy and Tactics to Optimize Results Building the BCA (continued) • “Rack ‘em and Stack ‘em” • Comparison of the baseline and alternatives • against selection criteria…………. • Financial comparisonsshould attempt to • compare like attributes, and summary metrics, • like NPV; rate of return; payback period; cost • avoidance. • Non-quantifiable factors, when possible, should • be compared using weighting and/or ranking • schemes against common decision criteria: • Convert “subjective” values to “objective” values • Feasibility; ease of implementation • acceptance by customer or workforce • politics and personalities • “gut feel” management dynamics • past performance
Executive Summary Introduction/Overview Subject, Purpose, Scope and Objectives Background Organization Major Assumptions and Constraints Financial Metrics Used and Defined Analysis Methodology The Cost and Benefit Model Used (Explanation of Cost Types and Categories) Description of Alternatives Costs and Benefits Over Time Financial Analysis Non-quantitative Factors, Criteria, and Rationale for Their Use Comparison of Alternatives (quantitative and qualitative) Sensitivity Analysis Risk Analysis Conclusions and Recommendations Results Rationale Choice of Scenarios for Implementation Strategy and Tactics to Optimize Results Building the BCA (continued) Sensitivity analysisattempts to explain what happens if assumptions change or prove wrong (“what if drills”). How sensitive are your financial model’s overall outputs, to changes of individual inputs? Ifthis cost changes, how does it affect the “bottomline”;can be quantitative or qualitative. Risk analysisattempts to predict the likelihood of an event occurring, and the impact to the case outcome.For some situations, risk analysis can occupy the most volume and level of effort of the entire business case development;can be quantitative or qualitative.
Types of Sensitivity Analysis • Simple Sensitivity Analysis • Other analysis methods: • Tornado Diagrams • (Monte Carlo) Simulations • Models
Simple Sensitivity Analysis Average Oil Price ($/Barrel Crude) • Varying one assumption, while holding all other assumptions constant • This shows the combined results of such an approach with two assumptions. • The curves indicate that projected cash flow results (vertical axis) are sensitive to changes in business volume • But relatively insensitive to changes in average oil price. 15 17 19 21 23 25 11,000 10,000 9,000 8,000 7,000 6,000 Projected Total cash Flow ($K) 5,000 4,000 Business Volume 3,000 Oil Price 2,000 1,000 0 Average Annual Business Volume ($K) 20,000 24,000 28,000 32,000 36,000 40,000
Risk Assessment • The following areas should be assessed: • Technical Risk • Maturity of technology and processes reliant on technology • Schedule Risk • Any scheduling issues that may impact success? • Funding Risk • Are funds identified for which availability is reliant on pending events or approvals? Have adequate funds been identified? • Traceability Risk • How will claimed cost avoidances be tracked and documented? • Other Risk • Any other risks that have not been addressed above • Risk Summary • Overview of the risk associated with implementing the initiative • e.g. “is there adequate service life remaining to justify this change?”
Risk Analysis Model Assessment Guide Risk Assessment e M M H H H HIGH– Unacceptable. Major disruption likely; different approach required; priority management attention required. What is the Likelihood the Risk Event will occur? Level R L M M H H d a Remote MODERATE – Some disruption; different approach may be required; additional management attention may be needed. L L M M H c LIKELIHOOD b Unlikely Y L L L M M c Likely b d Highly Likely L L L L M a e Near Certainty a b c d e LOW – Minimum impact; minimum oversight needed to ensure risk remains low. G IMPACT Technical Performance And/ or And/ or And/ or Impact on Other teams Schedule Cost Minimal or no impact a Minimal or no impact Minimal or no impact None Additional resources required; able to meet need dates Acceptable with some reduction in margin b <5% Some impact Acceptable with significant reduction in margin Minor slip in key milestones; not able to meet all need dates c 5-7% Moderate impact Acceptable; no remaining margin d Major slip in key milestone or critical path impacted 7-10% Major impact e Can’t achieve key team or major milestone Unacceptable >10% Unacceptable
Executive Summary Introduction/Overview Subject, Purpose, Scope and Objectives Background Organization Major Assumptions and Constraints Financial Metrics Used and Defined Analysis Methodology The Cost and Benefit Model Used (Explanation of Cost Types and Categories) Description of Alternatives Costs and Benefits Over Time Financial Analysis Non-quantitative Factors, Criteria, and Rationale for Their Use Comparison of Alternatives (quantitative and qualitative) Sensitivity Analysis Risk Analysis Conclusions and Recommendations Results Rationale Choice of Scenarios for Implementation Strategy and Tactics to Optimize Results Building the BCA (continued) Conclusionsshould state the complete case tersely, but completely, supporting your evidence from the preceding sections.Effective conclusions are organized around the objectives stated up front in the case.Did the recommended alternative cost less? Was it ‘best value’?Also, point out any surprising or unexpected results or findings that could be misinterpreted. Recommendationsbrings closure to the case and reminds the reader the “ball is in their court” “OK boss, what’s your decision?” Just like a court case, the business case should provide support your recommendation that a “reasonable person” would find compelling.
Executive Summary Introduction/Overview Subject, Purpose, Scope and Objectives Background Organization Major Assumptions and Constraints Financial Metrics Used and Defined Analysis Methodology The Cost and Benefit Model Used (Explanation of Cost Types and Categories) Description of Alternatives Costs and Benefits Over Time Financial Analysis Non-quantitative Factors, Criteria, and Rationale for Their Use Comparison of Alternatives (quantitative and qualitative) Sensitivity Analysis Risk Analysis Conclusions and Recommendations Results Rationale Choice of Scenarios for Implementation Strategy and Tactics to Optimize Results Building the BCA (continued) Put together a basic Plan of Action and Milestones (POA&M) to portray how your recommendation becomes realty. This is good “marketing”. Actions 1stQtr 2ndQtr 3rdQtr 4thQtr Get Money Solicit Bidders Award Contract Process Review Test & Eval Final Spec Customer Survey Penetrate Market
Manager’s Basic BCA Checklist • Does the case try to point to a“preordained”decision? • If subjective factors exist, are they portrayed to show their “value” and contribution to the recommendation? • Are Subject, Purpose and Scope up front and clear?Does the Executive Summary “package” the whole case? • Does thecase compare the baseline toat least 2 alternatives? • Are assumptions and methods presented to identify benefits and costs? • Is thecost modelorganized along a timeline? • Is thetime value of moneyaccounted for? • Does the case include the important and relevant costs and benefits, even those that are not quantifiable, and are they consistently portrayed across all alternatives? • Does the case identify and measure sensitivity and risks? • Does the case discuss critical success factors? What must happen, when, and by who, to achieve expected results?
PBL IMPLEMENTATION MODEL Integrate Requirements & Support Form the PBL Team Baseline The System Identify Performance Outcomes Implement And Oversight Select PSI PBL BCAs Financial Enablers Workload Allocation Strategy Accomplish Contracts Business Case Analysis Establish PBAs SCM Strategy