Download
1 / 18
180 likes | 439 Views
Argo: the challenge of continuing 10 years of progress. The Argo Steering Team GODAE Final Symposium Nice, 12-15 November 2008. Outline. The evolution of Argo. Argo’s effectiveness. The Argo-era global ocean. Argo and ocean surface data. The future of Argo.

E N D
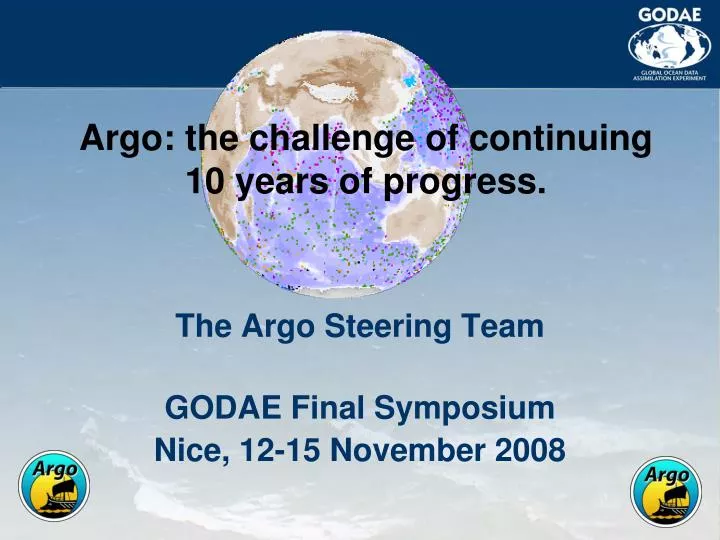
Argo: the challenge of continuing 10 years of progress. The Argo Steering Team GODAE Final Symposium Nice, 12-15 November 2008
Outline • The evolution of Argo. • Argo’s effectiveness. • The Argo-era global ocean. • Argo and ocean surface data. • The future of Argo. Ocean Data Assimilation is a key application for Argo. Please submit comments and questions for the Argo Roundtable. Argo deployment training with N.Z. Minister of Research, Science and Technology, October 2007. Photo by A. Blackwell (NIWA)
A technology revolution: • In the 1990s, a global survey required many years of research vessel effort. • Today high quality data can be collected anywhere in the world without a ship being present at the time. (continuous, global data) In the WOCE global survey, ~8000 CTD profiles were collected by RVs from 1991-1997. Argo obtains 9000 CTD profiles per month.
An idea to a global array in 10 years. 400,000 high quality profiles have been collected during 2004-2008. Left: profiles per 1o box, 2004-2008. 3000 floats obtain 9000 profiles per month. • The key factors were: • The enabling technology. • An international partnership of science and agencies. • An open data policy, with free and immediate access. • GODAE is one of Argo’s “parents”.
Argo’s impact is greatest in the southern hemisphere. Red dots: Winter 1950-2000 (WOD) Black dots: Winter 2008 (Argo) Argo obtains more winter T,S profiles in a single year than in all pre-Argo winters combined. Argo 3o x 3o design Nevertheless, Argo has not yet achieved its designed coverage in the southern hemisphere, where an additional 750 floats are needed. The shortfall will impact many applications. Floats per degree of latitude Argo present distribution Equal area distribution
How effective is Argo for large-scale variability? Argo SST anomaly, Dec 2006 Argo SST anomaly Niño 3.4 (Argo) NOAA OI SST anomaly, Dec 2006 NOAA OI SST anomaly Niño 3.4 (NOAA OI) • Argo mapping error can be estimated in several ways: • Formal OI error estimates. • Maps from subsets of Argo data. • Altimetric height subsampling experiments. • Comparison to independent datasets such as SST.
The large-scale signal and Argo sampling noise: Argo is most effective in the tropics. More floats are needed in the southern hemisphere. Altimetric height subsampling experiment: Zonally averaged variance of large-scale (10o x 10o x 3 months) anomalies (mean and annual cycle removed): Black: Signal variance from 15-year AVISO dataset, 1993-2007. Blue: Signal variance from 4-year dataset, 2004-2007. Thick red: Noise upper bound, SSH minus steric height, 2004-2007. Thin red: Noise lower bound, SSH minus subsampled and re-mapped SSH, 1993-2007. SSH SIGNAL NOISE SST Argo/ NOAA OI SST comparison: Black: Signal variance from 15-year dataset, 1993-2007. Blue: Signal variance from 4-year dataset, 2004-2007. Red: Noise upper bound, NOAA OI SST minus Argo SST, 2004-2007. SIGNAL NOISE
Systematic errors? (Right) Willis et al. (2008) noted that the increase in global sea level is not seen in 4-year records of steric sea level and ocean mass. How accurate is the global mean temperature and steric height from Argo? A highest priority for Argo is to identify and correct systematic errors (e.g. p0 drift) and to estimate their impact. Global mean sea level variability (top), steric component from Argo (middle), mass component from GRACE (bot). Grey lines represent the residual of the other two measurements. From Willis, Chambers, and Nerem (GRL, 2008).
Testing the Argo dataset. New techniques are being developed for error detection. Altimetric height is used to flag anomalies in Argo steric height for expert examination (Guinehut et al., 2008). Here a problem is detected in data from Float 5900984.
Testing the Argo dataset. Argo and shipboard transects show similar and consistent decadal signals in temperature along 24.5oN in the Atlantic. (Vélez-Belchí, Hernández-Guerra and Fraile-Nuez, 2008). RAPID - IGY Argo - IGY RAPID - IGY Argo - WOCE
The Argo-era ocean. The Argo dataset, 2004-2008, provides an accurate 5-year mean and annual cycle for the global ocean. Argo can be compared to past datasets and is a baseline for observing future evolution. Maps of Argo-minus-WOA01 steric height highlight the large and deep density changes south of 30oS. Roemmich and Gilson (2008)
The Argo-era ocean. • The southern hemisphere ocean is warmer and fresher in the Argo era than in WOA01. • The northern hemisphere is warmer and saltier. • Heat gain is dominated by the southern hemisphere (larger area). • The surface layer stratification is increased. • The Argo ocean is fresher in high rainfall regions, saltier in high evaporation regions (increase in the global hydrological cycle?) Global averages of Argo-minus-WOA01 T and S Zonal averages of T, S, and σθ from Argo (contours), and the Argo- minus-WOA01 differences (colors). Roemmich and Gilson (2008).
The Argo-era ocean. • Argo-minus-WOA01 salinity differences on density surfaces, excluding the upper 200m. • Subsurface waters are fresher in the SH intermediate waters (all oceans) and below the ITCZ. • Subsurface waters are saltier below evaporative regions and NH intermediate waters (Atlantic).
Argo and ocean surface datasets. Argo SH AVISO SSH NOAA OI SST Argo SST Argo A-S flux NOC A-S flux Argo zonally-averaged annual cycle is compared to altimetric height, SST, and air-sea flux.
Argo and ocean surface datasets. Sea Surface Height Sea Surface Temperature SH Hemispheric and global annual cycles are compared for consistency and for complementary information. SH: southern hemisphere NH: northern hemisphere GL: global SH GL GL NH NH Argo SH AVISO SSH Difference Argo SST NOAA OI SST Air-Sea flux Sea Surface Salinity NH NH GL GL SH SH Argo heat gain NOC A-S flux Argo SSS WOA01 SSS
Argo’s future: two paths forward. • Improved implementation for Argo’s original objectives: • Increased float lifetime. • Enhanced float capabilities. • Better coverage in the southern hemisphere. • Detection/correction of systematic errors. Right: A 6–year record, with stable salinity, by a UW float in the Indian Ocean (fig. provided by A. Wong). Float lifetimes continue to improve through technical innovation and careful handling.
Argo’s future: two paths forward. 2. Potential objectives to increase Argo’s value: • Abyssal floats to sample the full water column. • New sensors: biological, geochemical, surface layer, … • Regional arrays in marginal seas. • High latitude floats under seasonal ice. • Glider sampling in boundary currents. Argo was designed for the ice-free oceans, but there are now many floats in the seasonal ice zones. A UW float is deployed through the ice on a cruise by R/V Aurora Australis. Photo: G. Williams
Argo’s future: the planning process. • This GODAE F.S. Argo paper is intended to initiate a review of Argo’s status and a discussion of its future priorities. Contribute via the Argo Round Table. • Argo’s 3rd Science Workshop, “The Future of Argo” will be held in Hangzhou in March 2009. http://www.argo.ucsd.edu/ASW3.html . • Broad input and participation are invited (including ODA Argo users). • A Community White Paper for OceanObs09 will be developed.