Download
1 / 9
90 likes | 319 Views
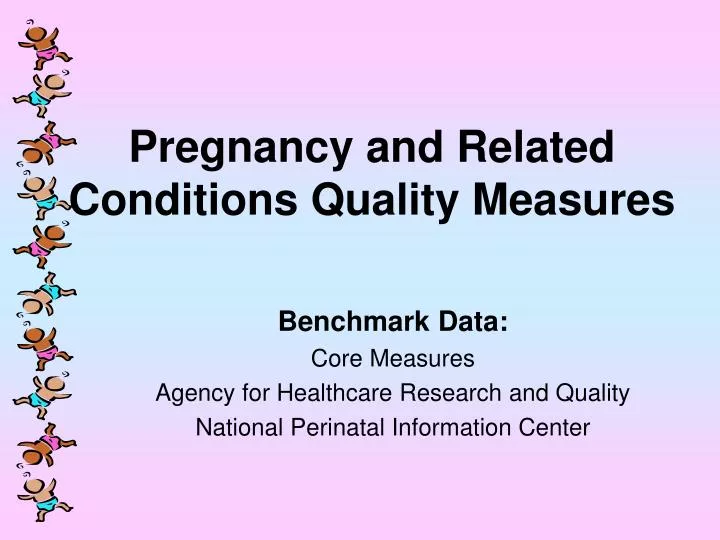
Pregnancy and Related Conditions Quality Measures. Benchmark Data: Core Measures Agency for Healthcare Research and Quality National Perinatal Information Center. Project Aim. Committee: S.Swanson RN; J.Gianopolous, MD; R.Beisinger, MD; E.Carroll, MD;

E N D
Pregnancy and Related Conditions Quality Measures Benchmark Data: Core Measures Agency for Healthcare Research and Quality National Perinatal Information Center
Project Aim Committee: S.Swanson RN; J.Gianopolous, MD; R.Beisinger, MD; E.Carroll, MD; M.Weiss, MD; G.Adams, RN; M.Chybik, RN; M.Wall, PharmD; M.Davey, RN; P.Downing, RN; C.LaPorte, RN; E.Trulis, RN Improve the PREGNANCY AND RELATED CONDITIONS CORE MEASURES, AHRQ and NPIC quality measure performance, attaining UHC median performer status and then progress to UHC BEST PERFORMER
No internal champion Risk adjustment poorly understood Benchmark data reviewed in aggregate 9-12 months after care Improvement impact slow to be seen and hard to track Meeting chaired by AD; case managers lead work for area Reviewed indicators and defined in packets Case review information for cases included in the most recent data included in meeting packet Review expanded to current charts looking for improvement and continuing issues. Barriers and Actions
Core Measures Third or Fourth Degree Laceration 6 Chart review by physician with feedback communication with coding Reviewed definitions Restructured meetings to have chart review data available for discussion Documentation education 5 Concurrent chart review 4 Percent Meeting chaired by AD Case manager role defined 3 2 2004 Q1 (n=265) 2004 Q2 (n=244) 2004 Q3 (n=254) 2004 Q4 (n=235) 2005 Q1 (n=250) 2005 Q2 (n=235) 2005 Q3 (n=254) 2005 Q4 (n=235) 2006 Q1 (n=279) 2006 Q2 (n=247) 2006 Q3 (n=271) LUMC Observed Third and Fourth Degree Laceration Rate LUMC Expected Third and Fourth Degree Laceration Rate Quarter
AHRQ Patient Safety & Quality Indicators Obstetric trauma - vaginal delivery without instrument 14 12 10 8 6 Rate per 100 cases 4 2 2004 Q1 (n=246) 2004 Q2 (n=217) 2004 Q3 (n=231) 2004 Q4 (n=225) 2005 Q1 (n=225) 2005 Q2 (n=217) 2005 Q3 (n=234) 2005 Q4 (n=223) 2006 Q1 (n=260) 2006 Q2 (n=227) 2006 Q3 (n=256) LUHS Rate UHC Ninetieth Percentile UHC Median UHC Tenth Percentile Quarter (Number of LUMC cases) This information is confidential and to be used for quality improvement purposes only Meeting chaired by AD Case manager role defined Documentation education Reviewed definitions Concurrent chart review Restructured meetings to have chart review data available for discussion Chart review by physician with feedback communication with coding
AHRQ Patient Safety & Quality Indicators Obstetric trauma - vaginal delivery with instrument 40 Concurrent chart review 35 Reviewed definitions Restructured meetings to have chart review data available for discussion Documentation education 30 Meeting chaired by AD Case manager role defined 25 20 Chart review by physician with feedback communication with coding Rate per 100 cases 15 10 2004 Q1 (n=19) 2004 Q2 (n=27) 2004 Q3 (n=23) 2004 Q4 (n=10) 2005 Q1 (n=26) 2005 Q2 (n=17) 2005 Q3 (n=21) 2005 Q4 (n=12) 2006 Q1 (n=15) 2006 Q2 (n=19) 2006 Q3 (n=15) LUHS Rate UHC Ninetieth Percentile UHC Median UHC Tenth Percentile Quarter (Number of LUMC cases) This information is confidential and to be used for quality improvement purposes only
Core Measures Neonatal Mortality (Birth Weight Range 150g - 999g) 100 Worked with JCAHO to redefine measure criteria 80 Began review of all mortality for co-morbidity accuracy Developed mechanism to capture birth weights Reviewed documentation of living cohort for accurate co-morbidity capture 60 Worked with fellow to maintain full problem list Percent 40 20 2004 Q1 (n=1) 2004 Q2 (n=7) 2004 Q3 (n=18) 2004 Q4 (n=21) 2005 Q1 (n=23) 2005 Q2 (n=18) 2005 Q3 (n=18) 2005 Q4 (n=18) 2006 Q1 (n=17) 2006 Q2 (n=23) 2006 Q3 (n=19) LUMC Observed Neonatal Mortality Rate (150g - 999g) LUMC Expected Neonatal Mortality Rate (150g - 999g) Quarter
AHRQ Patient Safety & Quality Indicators Birth trauma - injury to neonate 1.4 1.2 1.0 Communication with Coders Chart review definition clarification 0.8 0.6 Rate per 100 cases 0.4 0.2 0.0 2004 Q1 (n=404) 2004 Q2 (n=366) 2004 Q3 (n=391) 2004 Q4 (n=394) 2005 Q1 (n=423) 2005 Q2 (n=390) 2005 Q3 (n=404) 2005 Q4 (n=401) 2006 Q1 (n=424) 2006 Q2 (n=421) 2006 Q3 (n=455) LUHS Rate UHC Ninetieth Percentile UHC Median UHC Tenth Percentile Quarter (Number of LUMC cases) This information is confidential and to be used for quality improvement purposes only
Next Steps Utilize UHC coding expertise to identify issues with injury to neonate. Continue concurrent chart review for timely feedback and awareness of practice. Review a neonatal cohort to assess accuracy of complications/co-morbidity capture for risk assessment of surviving cases. Work with physicians to maintain comprehensive documentation to facilitate accurate risk capture. Enhance EPIC use to capture necessary data. Incorporate education of coders/residents into orientation to obtain/maintain gains.