Download

1 / 34
340 likes | 445 Views
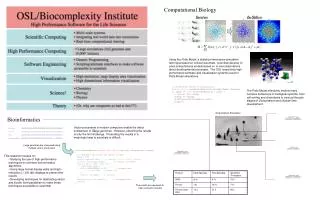
Computational Biology Group. Class prediction of tumor samples Supervised Clustering Detection of Subgroups in a Class. Training Set. Test Sample. Class prediction : Assign unknown samples to already known classes.

E N D
Class prediction of tumor samplesSupervised ClusteringDetection of Subgroups in a Class
Training Set Test Sample
Class prediction : Assign unknown samples to already known classes For this procedure we use a set of samples for which we already know the class that they belong to Identification of proper molecular markers (genes) that are able to discriminate one class from the other. There are genes that add noise and maybe there are genes that are able to discriminate these classes The genes are thousands
…Some Definitions • A Training Dataset D, which has M samples and N genes • Arbitrarily we assign the label 0, for the genes that belong to the first class and the label 1 for the genes that belong to the second classIf the DataSet has more than two classes One Class vs All or One Class vs Another class • For each gene g there is a vector : Eg = ( e1, e2, … , em ) • Construction of the labeling vector Vg = (v1, v2, … , vm) • Eg’ is the sorted vector of Eg • Based on this vector we constructed the labeling vector Vg.
Threshold value Eg = (10,25,53,78,96,122,154,198,221,256,318,455,487,503,556,601,621,647,733,785) R2 R1 Vg = (111 00 10 11 1 10 00 00 00 0 0) Paccepted = 0.7 Gene g is an informative gene, which belongs to Category I and it is a Class Zero Classifier
Informative Genes • Category I : There is an homogeneous region only in one side • Category II : There is an homogeneous region in each side, but from opposite classes • Category III : There is an homogeneous region in each side, from the same class
Class Prediction • Weighted VotingClass Zero Classifier: assignment of weight W0Class One Classifier : W1 W0, W1 : inversely proportional to the number of vectors that there are in each Class Classifier W0 > 0W1 < 0
Class Prediction Gene g can vote for S1 S1 takes one vote for class 0 Gene g cannot vote for S2 S2 = ? E(S1) > 455 E(S2) < 455 Eg = (10,25,53,78,96,122,154,198,221,256,318,455,487,503,556,601,621,647,733,785)
….So after these procedure, for all samples in the test set… • …for each Test Set Sample there are different informative genes that can predict its Class • If (n : the number of informative genes for this sample)This sample belongs to Class Zero • If This sample belongs to Class One
How can we use the information that different samples are characterized from different informative genes ?
Distances between samples • Two samples will be more relative than two others if they share a larger number of informative genes which assign them to the same class.
Computation of distances between samples are the measures of the similarity, between sample i, and sample j. is the number of the common informative genes that classify samples i, j in class 0 and 1, respectively. is the number of the total informative genes that classify samples i, j in class 0 and 1, respectively
Construction of a distance matrix, with pairwise distances between all samples • For the visualization of the results we used MEGA2 software, which constructs dendrograms. • UPGMA Tree (Unweighted Pair Group Method using Arithmetic averages)= Hierarchical Clustering • Neighbor – Joining Tree
If we merge Training Set and Test Set, and create a new DataSet with all Samples…. We expect that the samples from the test set that, belong to a particular class, will be placed near or generally in the same group with the training set samples which belong to the same class
Detection of Subgroups of Samples • Using the method of Supervised Clustering we described above, we were able to detect subgroups of samples • …from the training set • …and the test set
When we apply this algorithm to the Training Set, the Classification has no meaning, because it is according to the pre-existed labels (This is a consequence of the selection of informative genes. The Regions are completely homogeneous, so, a priori the classification in the Training Set will be consistent with the labels). …However we can use this method in order to detect Subgroups of Samples inside a certain Class.
Neighbor-Joining Unrooted Tree of the Test Set From West et al. On the right of purple lines is the ER+ class, and on the left the ER- Class ind2 is misclassified.
Some problems of these methods • In some datasets there are a few genes with homogeneous regions with P value larger than 0.7. The weighted voting method doesn’t work very well when the P value is low • There is a need for enough samples from both classes in the training set.
Detection of Groups of Genes that are able to classify a sample • We tried to determine somehow, the properties of a group of genes (pairs, triplets…) that will be able to predict the class of a sample. • We don’t consider as a “group”, the set of “good” informative genes that are able to classify a sample, with a high percentage of success...
Instead of that we look for group of genes that individually aren’t so good class predictors. • …However they can predict the class precisely when they form a group. • So the prediction strength is a property of the group, and not a property of the genes that constitute this group
Detection of pairs of genes (If P<0.5 then it is impossible to find a pair of genes) Paccepted > 0.5 Eg1 = (78,96,122,154,198,221,256,318,455,487,503,556,601,621,647,733,785) Eg2 = (285,305,227,512,756,820,839,872,896,907,921,965,971,985,992,995) Vg1 = (00 10 11 1 10 0 1 1 0 00 0 0) Vg2 = (0 11 0 1 10 10 1 00 0 0 0 0) Ig1 = ( 12, 16, 18, 13, 1, 20, 19, 6, 4, 15, 3, 8, 11, 10, 9, 14, 17) Ig2 = (17, 16, 18, 14, 1, 20, 9, 6, 10, 15, 3, 8, 12, 13, 19, 4)
This means that no one sample from class Zero, can have simultaneously an expression value below (or above) threshold A for g1, and below (or above) threshold B for g2. • This is possible only for samples from class One.
The procedure of Class Prediction is similar to the procedure which was described above for single genes. • We do exactly the same for the detection of triplets of genes. (P value > 0.333)
Some advantages of this approach We can utilize the samples from one Class for the construction of classifiers for the other Class. This is important when the number of samples in one class is small (example) P value is lower in this case. So we detect more genes that potential can create pairs of genes. It considers that the biological mechanisms are more complex. This might be closer to reality.