Download
1 / 56
560 likes | 719 Views
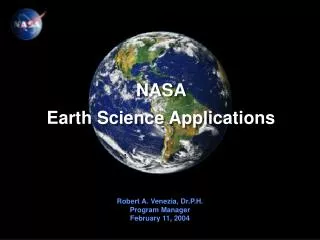
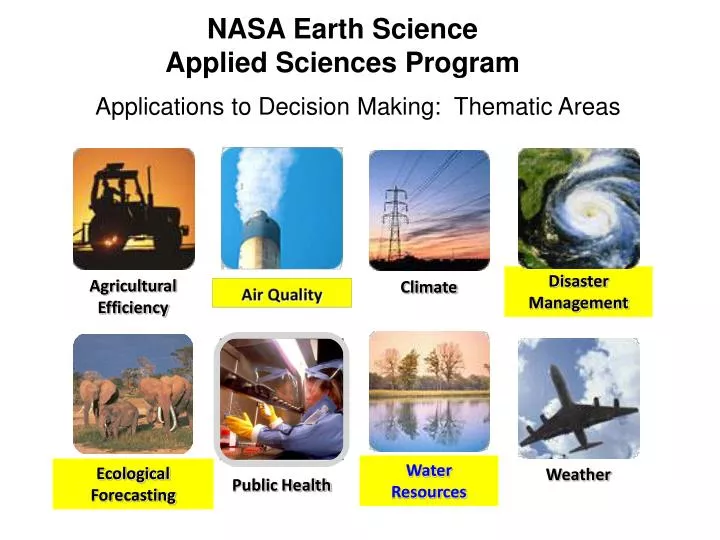
Weather. Climate. Disaster Management. Ecological Forecasting. Water Resources. Public Health. Agricultural Efficiency. NASA Earth Science Applied Sciences Program. Applications to Decision Making: Thematic Areas. Applied Remote Sensing Training Program (ARSET)

E N D
Weather Climate Disaster Management Ecological Forecasting Water Resources Public Health Agricultural Efficiency NASA Earth ScienceApplied Sciences Program Applications to Decision Making: Thematic Areas
Applied Remote Sensing Training Program (ARSET) (part of NASA Applied Sciences) GOAL: Increase utilization of NASA observational and model data for decision-support Online and hands-on courses: • Who: policy makers, environmental • managers, modelers and other professionals • in the public and private sectors. • Where: U.S and internationally • When: throughout the year. Check websites. • Do NOT require prior remote- sensing • background. • Presentations and hands-on guided • computer exercises on how to access, • interpret and use NASA satellite images for • decision-support. NASA Training for California Air Resources Board, Sacramento
LAND COVER Applied Remote Sensing Training Program (ARSET) • Health (Air Quality) • 2008 – present • 26 Trainings • +700 end-users • Analysis of dust, fires and urban air pollution. • Long range transport of pollutants • Satellite and regional air quality model inter-comparisons. • Support for air quality forecasting • and exceptional event analysis • Water Resources and Flood Monitoring • April 2011 – present • 6 Trainings • +300 end-users • Flood/Drought monitoring • Severe weather and • precipitation • Watershed management • Climate impacts on water resources • Snow/ice monitoring • Evapotranspiration (ET), ground water, soil moisture, and runoff. Nitrogen Dioxide over China Satellite derived precipitation Inundation mapping • Land Use/Change and Ecology • Beginning in 2014 • Webinars and in-person courses • Topics to be informed by ongoing end-user needs assessment • GIS applications • Land use/change and vegetation indices • Fire products Land Cover Smoke
Gradual Learning Approach Basic Courses Webinars Hands-on Assumes no prior knowledge of RS Advanced Courses Hands-on Webinar course generally required Focused on a specific application/problem: for example dust or smoke monitoring in a specific country or region
ARSET: 2009 – 2013 +1000 End-users Reached Number of participating organizations per country: Air Quality, Water Resources, Flood Monitoring.
http://airquality.gsfc.nasa.gov/ Publicly available Modules Case Studies Upcoming trainings
NOTE: New ARSET website coming soon Sign up to the listserve for new website information and URL, and for program updates https://lists.nasa.gov/mailman/listinfo/arset
ARSET Contact Information • Overall program information Ana Prados: aprados@umbc.edu • Interest in future ARSET activities Pawan Gupta: pawan.gupta@nasa.gov
Fundamentals of Satellite Remote Sensing Instruments and Applications Introduction to Remote Sensing and Air Quality Applications for the Indian Sub-Continent and Surrounding Regions ARSET AppliedRemoteSEnsingTraining A project of NASA Applied Sciences
Outline • What you should expect from this course. • Why use remote sensing? • Advantages and Limitations of Remote Sensing • Sensors and Satellites • Satellite Capabilities, Satellite Products and their Application to Remote Sensing
What should you expect from this webinar series? Satellite Measurements Satellite Products Air Quality Applications
What should you not expect as a result of this webinar series ? • The capability to perform research using satellite remote sensing data. • A complete knowledge of all of the satellite products and web tools which can be used for air quality applications.
Some Things We Want to Know About Aerosols and Trace Gasses • Sources and sinks • Concentrations at the ground • Human exposure estimates • Acute exposure • Long term records • Air quality forecasts
Global Status of PM2.5 Monitoring Networks Brauer M, Ammann M, Burnett R et al. GBD 2010 Outdoor Air Pollution Expert Group 2011 Submitted –under review
Why Use Remote Sensing Data? Spatial Coverage - Satellite (MODIS) Retrieval Locations White Areas – No Data (Most likely due to clouds) – Ground Monitors
Spatial Coverage MODIS One Day Aerosol Product Coverage
Satellite Products for Air Quality Applications • Particulate Pollution (dust, haze, smoke) - Qualitative: Visual imagery - Quantitative*: Atmospheric Column Products • Fire Products: Fire locations or ‘hot spots’ Fire radiative power • Trace Gases - Quantitative*: Column Products - Vertical profiles: mostly mid-troposphere - Some layer products
Spring Summer Winter Fall 1.0 0.8 0.6 0.4 0.2 0.0 Some kinds of aerosol data available from satellite. Aerosol Optical Thickness Several satellites provide state-of-art aerosol measurements over global region on daily basis Haze & Pollution Dust Pollution & dust Biomass Burning
Dust Smoke Global Coverage Helps Us to Estimate Transport and Source Regions Aerosols Transported Across the Atlantic
Earth Satellite ObservationsAdvantages Air Quality/Pollution • Provides coverage where there are no ground monitors • Synoptic and trans-boundary view (time and space) • Visual context • Qualitative assessments and indications of long range transport • Adds value when combined with surface monitors and models
Earth Satellite Observations Limitations Temporal Coverage Vertical Resolution of Pollutants Lack of Near Surface Sensitivity Lack of specific identification of pollutant type
Common types of orbits Geostationary Polar Polar orbiting orbit fixed circular orbit above the earth, ~600-1000km in sun synchronous orbit with orbital pass at about same local solar time each day Geostationary orbit An orbit that has the same Earth’s rotational period Appears ‘fixed’ above earth Satellite on equator at ~36,000km
Observation Frequency Polar orbiting satellites – 1 - 2 observations per day per sensor - Geostationary observations - Polar observations Geostationary satellites – product quality is lacking in many locations
Remote Sensing …Sensors Passive Sensors: Remote sensing systems which measure energy that is naturally available are called passive sensors. Active Sensors: The sensor emits radiation which is directed toward the target to be investigated. The radiation reflected from that target is detected and measured by the sensor.
Limitations of Satellite Data Almost all satellite sensors are passive sensors. Passive sensors measure the entire column. Column measurements may or may not reflect what is happening at ground level. This is true whether we are measuring aerosols or trace gasses.
Principal Satellites in Air QualityRemote Sensing 380 Km MISR 1Km Calipso Space Borne Lidar 2300 Km MODIS 2400 Km OMI
Satellites Vs Sensors Earth-observing satellite remote sensing instruments are named according to 1) the satellite (also called platform) 2) the instrument (also called sensor) Aura Satellite Aqua Satellite • Four Instruments: • OMI • TES • HIRDLS • MLS • Six Instruments: • MODIS • CERES • AIRS • AMSU-A • AMSR-E • HSB
Primary Sensors - AEROSOLS MODIS MODerate resolution Imaging SpectroRadiometer Measures total column aerosol AOD - Aerosol Optical Depth MISR Multi-angle Imaging SpectroRadiometer AOD Particle Type VIIRS Visible Infrared Imaging Radiometer Suite AOD Particle Type
Primary Sensors – Trace Gases OMI Ozone Monitoring Instrument AIRS Atmosphere Infrared Sounder
Instrument Capabilities – for Air Quality Radiometers Imagers • MODIS – Terra and Aqua • 250m-1 KM Resolution • MISR • 275m- 1.1 KM Resolution • VIIRS • 6 KM Resolution • OMI – • 13 x 24 KM Resolution • GOME-2 • 40 x 80 KM Resolution • SCIAMACHY • 30 x 60 KM Resolution
Imagers & Sounders Imagers create images – MODIS, MISR Active and passive sounders can provide vertical profiles – Cloud Profiling Radar (CLOUDSAT) SAR (Synthetic Aperture RADAR) Atmospheric Infrared Sounder (AIRS)
Satellite/Sensor Classifications Some of the ways satellites/sensor can be classified • Orbits • Polar vs Geostationary • Energy source • Passive vs Active … • Solar spectrum • Visible, UV, IR, Microwave … • Measurement Technique • Scanning, non-scanning, imager, sounders … • Resolution (spatial, temporal, spectral, radiometric) • Low vs high (any of the kind) • Applications • Weather, Ocean colors, Land mapping, Atmospheric Physics, Atmospheric Chemistry, Air quality, radiation budget, water cycle, coastal management …
Ascending vs Descending Polar Orbits
MODIS-Aqua (“ascending” orbit) Approximately1:30 PM local overpass timeAfternoon Satellite MODIS-Terra (“descending”) Approximately10:30 AM local overpass time Morning Satellite
Pause for Questions • Important Note: Passive instruments measure reflected/emitted radiance at the top-of-atmosphere. All other information is derived from this and some ancillary data.
Remote Sensing … Remote sensing instrument measures reflected or emitted radiation
Transmission, Reception, and Processing (E) (A) Energy Source or Illumination Remote Sensing Process (D) Recording of Energy by the Sensor Interpretation and Analysis (F) (B) Radiation and the Atmosphere (C) Interaction with the Target Application (G) Reference: CCRS/CCT
(A) Energy Source or Illumination Remote Sensing Process (D) Recording of Energy by the Sensor (E) Transmission, Reception, and Processing Interpretation and Analysis (F) (B) Radiation and the Atmosphere (F) Interpretation and Analysis (C) Interaction with the Target Reference: CCRS/CCT
Energy Source or Illumination (A) Remote Sensing Process Recording of Energy by the Sensor (D) Transmission, Reception, and Processing (E) Interpretation and Analysis (F) Radiation and the Atmosphere (B) (G) Application Interaction with the Target (C) Reference: CCRS/CCT
Remote Sensing – Resolutions • Spatial resolution • The smallest spatial measurement. • Temporal resolution • Frequency of measurement. • Spectral resolution • The number of independent channels. • Radiometric resolution • The sensitivity of the detectors.
Pixel pixels - the smallest units of an image. Image pixels are normally square (but not necessary) and represent a certain area on an image/Earth.
increasing pixel size Scan direction bow-tie effect Flight direction Spatial Resolution Off-nadirpixel size IFOV FOV • Spatial Resolution : The highest magnification of the sensor at the ground surface • Satellite images are organized in rows and column called raster imagery and each pixel has a certain spatial resolution. Satellite height Nadirpixel size
Spectral Resolution • Spectral resolution describes the ability of a sensor to define fine wavelength intervals. The finer the spectral resolution, the narrower the wavelength range for a particular channel or band. • multi-spectral sensors - MODIS • hyper spectral sensors - OMI, AIRS
755 760 765 770 775 Wavelength (nm) In order to capture information contained in a narrow spectral region – hyper spectral instruments such as OMI, or AIRS are required
Radiometric Resolution • Imagery data are represented by positive digital numbers which vary from 0 to (one less than) a selected power of 2. • The maximum number of brightness levels available depends on the number of bits used in representing the energy recorded. • 12 bit sensor (MODIS, MISR) – 212 or 4096 levels • 10 bit sensor (AVHRR) – 210 or 1024 levels • 8 bit sensor (Landsat TM) – 28 or 256 levels (0-255) • 6 bit sensor (Landsat MSS) – 26 or 64 levels (0-63)
Radiometric Resolution 4 - levels 2 - levels 16 - levels 8 - levels In classifying a scene, different classes are more precisely identified if radiometric precision is high.
Temporal Resolution • How frequently a satellite can provide observation of same area on the earth • It mostly depends on swath width of the satellite – larger the swath – higher the temporal resolution • MODIS – 1-2 days – 16 day repeat cycle • OMI – 1-2 days • MISR – 6-8 days • Geostationary – 15 min to 1 hour (but limited to one specific area of the globe)