Download
1 / 15
150 likes | 273 Views
Florida Property Insurance Markets Economic and Financial Update. Insurance Information Institute Media Briefing Tallahassee, FL January 22, 2008. Robert P. Hartwig, Ph.D., CPCU, President Insurance Information Institute 110 William Street New York, NY 10038

E N D
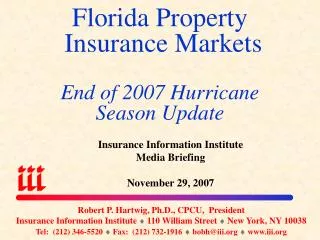
Florida Property Insurance MarketsEconomic and Financial Update Insurance Information Institute Media Briefing Tallahassee, FL January 22, 2008 Robert P. Hartwig, Ph.D., CPCU, President Insurance Information Institute 110 William Street New York, NY 10038 Tel: (212) 346-5520 Fax: (212) 732-1916 bobh@iii.org www.iii.org
Top 10 Most Costly Hurricanes in US History, (Insured Losses, $2005) Seven of the 10 most expensive hurricanes in US history impacted Florida: Andrew, Katrina, Wilma, Charley, Ivan, Frances & Jeanne Sources: ISO/PCS; Insurance Information Institute.
Landfalling Hurricanes: 1900-2007FL Landfalls are Common A hurricane strikes FL every other year on average—CAT 3+ every 4 years 1.7 hurricanes make landfall each year on average 38% of all hurricane landfalls occur in FL 37% of all FL landfalls are CAT 3+ Source: HURDAT database; Insurance Information Institute.
Inflation-Adjusted U.S. Insured Catastrophe Losses By Cause of Loss, 1987-2006¹ Insured disaster losses totaled $297.3 billion from 1987-2006 (in 2006 dollars). Hurricanes & tropical storms accounted for $137.7 billion of these—near half of the total. 1 Catastrophes are all events causing direct insured losses to property of $25 million or more in 2006 dollars. Catastrophe threshold changed from $5 million to $25 million beginning in 1997. Adjusted for inflation by the III. 2 Excludes snow. 3 Includes hurricanes and tropical storms. 4 Includes other geologic events such as volcanic eruptions and other earth movement. 5 Does not include flood damage covered by the federally administered National Flood Insurance Program. 6 Includes wildland fires. Source: Insurance Services Office (ISO)..
Distribution of US Insured CAT Losses: TX, FL vs US, 1980-2006* $ Billions of 2005 Dollars Florida accounted for 22% of all US insured CAT losses from 1980-2006: $57B out of $249.3B *All figures (except 2006 loss) have been adjusted to 2005 dollars. Source: PCS division of ISO.
Total Value of Insured Coastal Exposure (2004, $ Billions) Florida leads the way for insured coastal property at more than $1.9 trillion in 2004 and is expected to double by 2014 Source: AIR Worldwide
Historical Hurricane Strikes in Miami-Dade, FL, 1900-2007 Population of Miami-Dade County is 10 times what it was when the last period of intense activity began in the 1930s, lasting 30 years Source: NOAA Coastal Services Center, http://maps.csc.noaa.gov/hurricanes/pop.jsp?PopStormStates=FL&PopStormCounty=; Insurance Info. Institute, accessed 11/28/07.
FLORIDA HURRICANES & INSURER PROFITABILITY:Selling Home Insurance in Florida is Challenging
Underwriting Gain (Loss) in Florida Homeowners Insurance, 2004 - 2007E* Private Insurers** $ Billions Over the past four years, underwriting losses exceeded premiums in Florida by an estimated $6.7 billion *2007 estimate by Insurance Information Inst. based on historical loss, expense and premium data for FL. **Does not include Citizens Property Insurance Corporation results.
Underwriting Gain (Loss) in Florida Homeowners Insurance, 1992-2007E* Private Insurers** $ Billions Florida’s homeowners insurance market produces small/modest profits in most years and enormous losses in others *2007 estimate by Insurance Information Inst. based on historical loss, expense and premium data for FL. **Does not include Citizens Property Insurance Corporation results.
Cumulative Underwriting Gain (Loss) in Florida Homeowners Insurance, 1992-2007E* Private Insurers** Regulator under US law has duty to allow rates that are “fair,” “not excessive” and “not unduly discriminatory.” Reality is that regulators in CAT-prone states suppress rates. $ Billions It took insurers 11 years (1993-2003) to erase the UW loss associated with Andrew, but the 4 hurricanes of 2004 erased the prior 7 years of profits & 2005 deepened the hole. *2007 estimate by Insurance Information Inst. based on historical loss, expense and premium data for FL. **Does not include Citizens Property Insurance Corporation results.
Rates of Return on Net Worth for Homeowners Ins: US vs. Florida 1990 – 2006E Averages: 1990 to 2006E US HO Insurance = -0.9% FL HO Average = -36.5% 4 Hurricanes Andrew Wilma, Dennis, Katrina Source: NAIC; 200/6 US and FL estimates from the Insurance Information Institute.
The Facts About Homeowner Insurer Profits and Losses in Florida • During the period from 1992 through 2007, private home insurers in Florida paid an estimated $6.2 billion more in claims than they received in premiums • This $6.2 billion underwriting loss remains even after including $2.96 billion in profits in 2006 and $3.4 billion in 2007 (est.) • It will take until 2009 for insurers just to get to the breakeven point for the 15 year period 1992-2009 even if there no storm losses in 2008 and 2009 • Florida Has Been a Money-Losing Proposition for Most Home Insurers in Terms of Return • The average annual rate of return on FL homeowners insurance was -36.5% from 1990-2006, despite a profitable 2006 • Even if insurers were to earn a 40% rate of return (implying no storm activity) every year, the average return for insurers will not exceed 0% until 2022. To reach the current 5% risk-free return on 10-year Treasury bonds would take until 2026 and a 10% return is unachievable until 2033
Florida State-Run Insurer Residual Deficits 2004/2005 (Millions of Dollars) The hurricanes seasons of 2004/5 weakened the FL Hurricane CAT Fund and Citizens, producing a gross state-run insurer deficit of $3.7 billion FL’s guarantee fund will also assess for at least $400 million Source: Insurance Information Institute research.
Insurance Information Institute On-Line WWW.III.ORG If you would like a copy of this presentation, please email me at bobh@iii.org