Download
1 / 10
100 likes | 108 Views
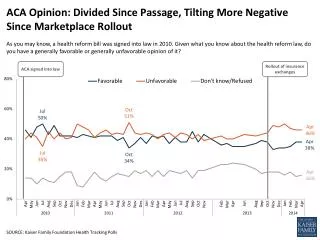
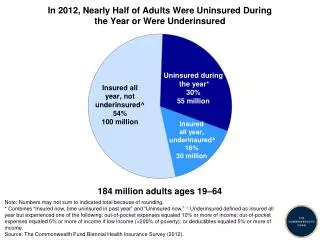
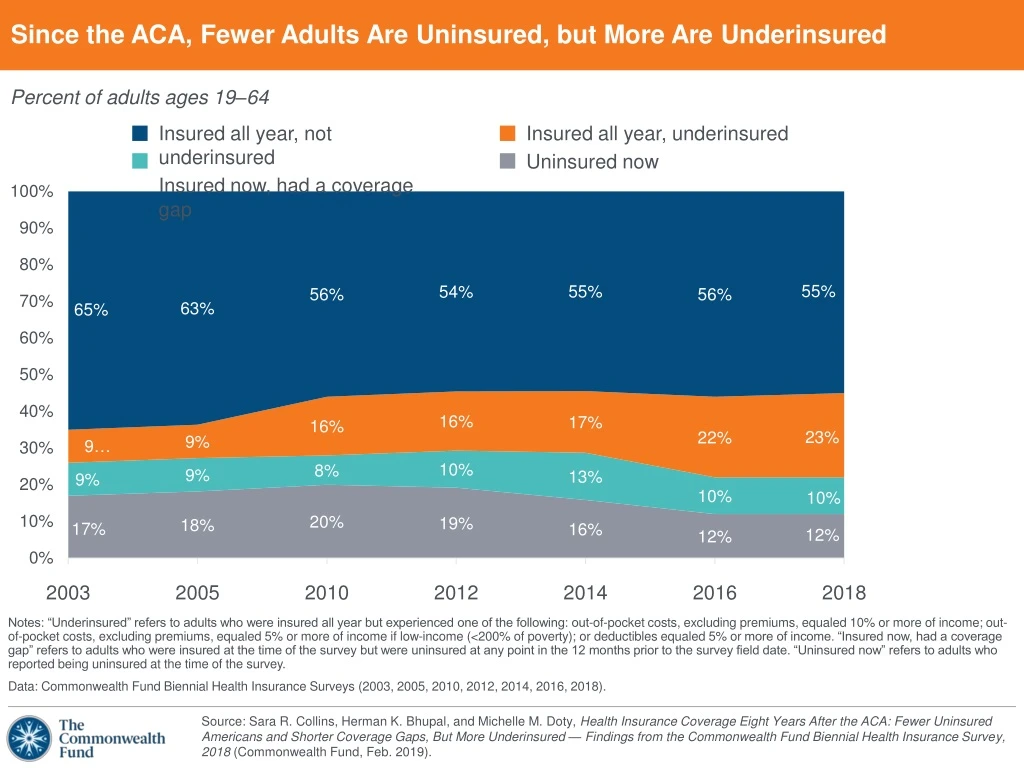
Since the ACA, Fewer Adults Are Uninsured, but More Are Underinsured. Percent of adults ages 19–64. Insured all year, not underinsured Insured now, had a coverage gap. Insured all year, underinsured Uninsured now.

E N D
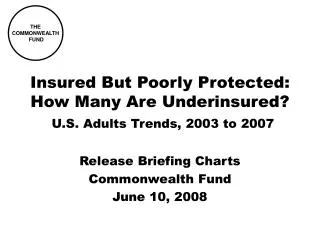
Since the ACA, Fewer Adults Are Uninsured, but More Are Underinsured Percent of adults ages 19–64 Insured all year, not underinsured Insured now, had a coverage gap Insured all year, underinsured Uninsured now Notes: “Underinsured” refers to adults who were insured all year but experienced one of the following: out-of-pocket costs, excluding premiums, equaled 10% or more of income; out-of-pocket costs, excluding premiums, equaled 5% or more of income if low-income (<200% of poverty); or deductibles equaled 5% or more of income. “Insured now, had a coverage gap” refers to adults who were insured at the time of the survey but were uninsured at any point in the 12 months prior to the survey field date. “Uninsured now” refers to adults who reported being uninsured at the time of the survey. Data: Commonwealth Fund Biennial Health Insurance Surveys (2003, 2005, 2010, 2012, 2014, 2016, 2018).
Since the ACA, Gaps in People’s Coverage Have Been Shorter Percent of adults ages 19–64 insured now but had a coverage gap in past year Data: Commonwealth Fund Biennial Health Insurance Surveys (2001, 2010, 2012, 2014, 2016, 2018).
There Has Been Some Improvement in Long-Term Uninsured Rates Percent of adults ages 19–64 who are uninsured now Data: Commonwealth Fund Biennial Health Insurance Surveys (2001, 2010, 2012, 2014, 2016, 2018).
More Adults Are Underinsured, with the Greatest Growth Occurring Among Those with Employer Coverage Percent of adults ages 19–64 insured all year who were underinsured Notes: “Underinsured” refers to adults who were insured all year but experienced one of the following: out-of-pocket costs, excluding premiums, equaled 10% or more of income; out-of-pocket costs, excluding premiums, equaled 5% or more of income if low-income (<200% of poverty); or deductibles equaled 5% or more of income. Total includes adults with coverage through Medicaid and Medicare. Respondents may have had another type of coverage at some point during the year, but had coverage for the entire previous 12 months. ^ For 2014 and 2016, includes those who get their individual coverage through the marketplace and outside of the marketplace. Data: Commonwealth Fund Biennial Health Insurance Surveys (2003, 2005, 2010, 2012, 2014, 2016, 2018).
Fewer Adults Report Not Getting Needed Care Because of Costs, but Gains Have Stalled in Recent Years • Percent of adults ages 19–64 who reported any of the following cost-related access problems in the past year: • Had a medical problem but did not visit doctor or clinic • Did not fill a prescription • Skipped recommended test, treatment, or follow-up • Did not get needed specialist care Data: Commonwealth Fund Biennial Health Insurance Surveys (2003, 2005, 2010, 2012, 2014, 2016, 2018).
Inadequate Coverage Is Associated with More Cost-Related Problems Getting Needed Care Percent of adults ages 19–64 who had any of four access problems in past year because of cost* Notes: * Includes any of the following because of cost: did not fill a prescription; skipped recommended medical test, treatment, or follow-up; had a medical problem but did not visit doctor or clinic; did not see a specialist when needed. “Underinsured” refers to adults who were insured all year but experienced one of the following: out-of-pocket costs, excluding premiums, equaled 10% or more of income; out-of-pocket costs, excluding premiums, equaled 5% or more of income if low-income (<200% of poverty); or deductibles equaled 5% or more of income. “Insured now, had a coverage gap” refers to adults who were insured at the time of the survey but were uninsured at any point in the 12 months prior to the survey field date. “Uninsured now” refers to adults who reported being uninsured at the time of the survey. Data: Commonwealth Fund Biennial Health Insurance Survey (2018).
Fewer Adults Have Difficulty Paying Their Medical Bills, but the Improvement Has Stalled • Percent of adults ages 19–64 who reported any of the following medical bill or debt problems in the past year: • Had problems paying or unable to pay medical bills • Contacted by a collection agency for unpaid medical bills • Had to change way of life to pay bills • Medical bills/debt being paid off over time Data: Commonwealth Fund Biennial Health Insurance Surveys (2005, 2010, 2012, 2014, 2016, 2018).
Inadequate Coverage Is Associated with More Problems Paying Medical Bills Percent of adults ages 19–64 who had medical bill or debt problems in past year* Notes: * Includes any of the following: had problems paying or unable to pay medical bills; contacted by collection agency for unpaid medical bills; had to change way of life to pay bills; medical bills/debt being paid over time. “Underinsured” refers to adults who were insured all year but experienced one of the following: out-of-pocket costs, excluding premiums, equaled 10% or more of income; out-of-pocket costs, excluding premiums, equaled 5% or more of income if low-income (<200% of poverty); or deductibles equaled 5% or more of income. “Insured now, had a coverage gap” refers to adults who were insured at the time of the survey but were uninsured at any point in the 12 months prior to the survey field date. “Uninsured now” refers to adults who reported being uninsured at the time of the survey. Data: Commonwealth Fund Biennial Health Insurance Survey (2018).
Continuously Insured Adults, Including Those Underinsured, Are More Likely to Get Preventive Care Percent of adults ages 19–64 Notes: “Continuously insured” refers to adults who were insured for the full year up to and on the survey field date. “Underinsured” refers to adults who were insured all year but experienced one of the following: out-of-pocket costs, excluding premiums, equaled 10% or more of income; out-of-pocket costs, excluding premiums, equaled 5% or more of income if low-income (<200% of poverty); or deductibles equaled 5% or more of income. “Insured now, had a coverage gap” refers to adults who were insured at the time of the survey but were uninsured at any point in the 12 months prior to the survey field date. “Uninsured now” refers to adults who reported being uninsured at the time of the survey. Respondents were asked if they: had their blood pressure checked within the past two years (in past year if has hypertension or high blood pressure); had their cholesterol checked in past five years (in past year if has hypertension, heart disease, or high cholesterol); and had their seasonal flu shot within the past 12 months. Data: Commonwealth Fund Biennial Health Insurance Survey (2018).
Continuously Insured Adults, Including Those Underinsured, Are More Likely to Get Cancer Screenings Percent of adults ages 19–64 Notes: “Continuously insured” refers to adults who were insured for the full year up to and on the survey field date. “Underinsured” refers to adults who were insured all year but experienced one of the following: out-of-pocket costs, excluding premiums, equaled 10% or more of income; out-of-pocket costs, excluding premiums, equaled 5% or more of income if low-income (<200% of poverty); or deductibles equaled 5% or more of income. “Insured now, had a coverage gap” refers to adults who were insured at the time of the survey but were uninsured at any point in the 12 months prior to the survey field date. “Uninsured now” refers to adults who reported being uninsured at the time of the survey. Respondents were asked if they: received a Pap test within the past three years for females ages 21–64, received a mammogram within the past two years for females ages 40–64, and received a colon cancer screening within the past five years for adults ages 50–64. Data: Commonwealth Fund Biennial Health Insurance Survey (2018).