Download
1 / 24
240 likes | 356 Views
EXERCISE PHYSIOLOGY FOR THE PRACTICING CLINICIAN. Ray F. Moss, Ph.D. Professor Health Sciences Furman University Director of Molnar Human Performance Laboratory. Components Of Running Performance. 100%. VO 2MAX. %Performance Capacity. Lactate Threshold. Running Economy. .5. 1.0. 1.5.

E N D
EXERCISE PHYSIOLOGY FOR THE PRACTICING CLINICIAN Ray F. Moss, Ph.D. Professor Health Sciences Furman University Director of Molnar Human Performance Laboratory
Components Of Running Performance 100% VO2MAX %Performance Capacity Lactate Threshold Running Economy .5 1.0 1.5 3.0 2.0 2.5 3.5 4.0 10.0+ Years of Training
CP reforming ATP ATP used Cash Currency for Performance Eventually all paid for aerobically
PCrShuttle Sarcomere Major Regulators of Cell Metabolism ADP ATP ATPase CPK PCr + ADPATP + Cr PCr Cr sarcoplasm CPK mitochondria ATPADP
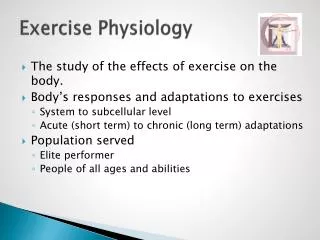
Maximal Oxygen Uptake • Maximal amount of oxygen that can be consumed during physical activity at sea level • VO2 = Cardiac Output x arterial – venous O2 Endurance athletes have VO2Max levels as high as 94 mlO2/kg/min for 76 kg athlete 212 b/min x 200 ml/beat x 20 Vol% - 3 Vol% = 7.2 L/min Average 25 year old male has VO2Max of 42 mlO2/kg/min
Contributing Factors • Very large stroke volumes Over 200 ml/beat (42 L/min) • Increased blood volume • Increased capillarization of skeletal muscle • Increase myoglobin All of these permit greater delivery of O2 to skeletal muscle to generate ATP
Maximal Oxygen Consumption VO2MAX 180 60.0 170 160 50.0 150 VO2Max 140 40.0 130 Heart Rate beats/min Oxygen Uptake in ml/min 120 30.0 110 100 20.0 90 80 10.0 70 60 Increasing Workload
Mitochondria and Training • Increases in Number/size of mitochondria May actually be a reticulum Density of mitochondria More protein per volume This reduces the “strain” on mitochondria during heavy exercise Mitochondria greater capacity to produce ATP
Adaptability / Trainability CHO(%) Trained “Cross-over” Fat(%) Untrained “Cross-Over” 60 100 FAT 40 80 20 60 CHO 0 40 0 (Rest) 50 100 (Max) Untrained 100 (Max) Trained Aerobic Power (%) 15 10 8 5 1-mile Pace (min/mile)
Lactate Threshold (LT) • When the body’s requirements of O2, surpass the body’s ability to deliver that O2, there begins a rapid rise in blood lactate Considered to be best predictor of endurance performance LT in untrained occurs about 50% of VO2Max LT in trained occurs as high as 90% of VO2Max
Determination Of Lactate Threshold Lactate Lactate Threshold Sample blood after every 4 minute stage of work Lactate Increase by 1 mM from previous stage Running Velocity
Lactate Threshold in Trained and Untrained Runners Untrained Lactate Trained LT 30 40 50 60 70 80 90 % VO2MAX
Lactate Appearance During Exercise 14 Pre-Training 12 Post-Training 10 8 Lactate Appearance (mg/kg min-1 6 4 2 0 0 0.5 1.0 1.5 2.5 3.0 2.0 VO2 (L/min) Brooks et al 2000
Lactate Clearance During Exercise 14 Post-Training 12 Pre-Training 10 Lactate Clearance (mg/kgmin-1) 8 6 4 2 0 1.0 2.0 3.0 4.0 5.0 Lactate (mM) Brooks et al 2000
Mono Carboxylate Transport Protein Lactate Lactate Oxidized Inside Mitochondrion
Running Economy And Performance Defined as the Cost of Running a Particular Pace Improving Economy Decreases the Cost of Running There are Many Areas in which to Improve Running Economy a. Biomechanically b. Metabolically c. Psychologically
Why Does It Take 10 + Years To Improve Economy? • Sarcoplasmic Reticulum and Associated Pumps • Sarcolemmal Transport Protein Carriers • a. Sodium Pump • b. Monocarboxilic Transport Protein • 3. Glucose Receptor Density • a. Glut 4 Receptors • 4. Mitochondrial Matrix/Membrane Proteins • 5. Biomechanics of Stride Rate/Length • a. Stretch-Shortening Cycle of Connective Tissue • 6. Heat Shock Prevention of Glycolytic and Oxidative • Metabolic Enzymes
Questions? Ha, Ha, Ha