Download
1 / 24
240 likes | 389 Views
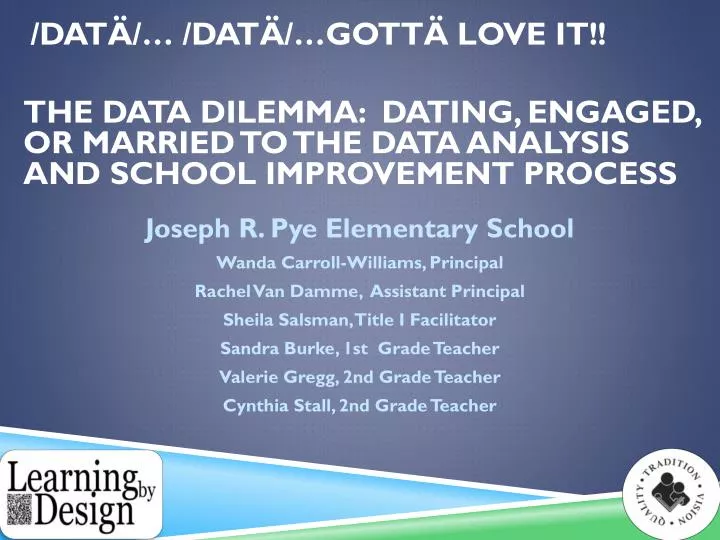
/ DAtä /… / Datä /… Gottä Love it!!. The Data Dilemma: Dating , Engaged, or Married to the Data Analysis and School Improvement Process Joseph R. Pye Elementary School Wanda Carroll-Williams, Principal Rachel Van Damme, Assistant Principal Sheila Salsman, Title I Facilitator

E N D
/DAtä/… /Datä/…Gottä Love it!! The Data Dilemma: Dating, Engaged, or Married to the Data Analysis and School Improvement Process Joseph R. Pye Elementary School Wanda Carroll-Williams, Principal Rachel Van Damme, Assistant Principal Sheila Salsman, Title I Facilitator Sandra Burke, 1st Grade Teacher Valerie Gregg, 2nd Grade Teacher Cynthia Stall, 2nd Grade Teacher
Mission and Vision Mission:Dorchester School District Two leading the way, every student, every day through relationships, rigor and relevance. Vision:Dorchester School District Two desires to be recognized as a “World Class” school district, expecting each student to achieve at his/her optimum level in all areas, and providing all members of our district family with an environment that permits them to do their personal best.
Session INFORMATION & Intended Outcomes • By the end of this session participants will have: • Reflected on their personal relationship with data use and analysis • Defined data and identified it’s purpose in the educational setting • Discussed their level of commitment to data use and analysis • Participated in a “think-pair-share” mock interview using a sample interview question about data • Discussed how focus on data and results contribute to the success of Organizational Learning Systems • Come to consensus on the 10 most important steps in the data analysis process • Identified essential data points • Discussed the guiding questions for “Courageous Conversations” Data Meetings • Reviewed sample Teacher Data Notebooks, Student Data Profiles, Student Data Portfolios, & Classroom Data Displays • Selected and developed Data Tools for use in their own schools or classrooms • Participated in evaluation of this session
Warming up to data… What’s your story… When I think about data numbers, charts, and graphs, I feel______, because______ Data phobic? Data fanatic?
What is Data? people…passion…proof It’s more than numbers. It’s also anecdotal information. It’s the faces and the bodies that fill carpet squares, & seats in the classroom. This is what makes our vision real. Its about the little people that we serve, the passion for our mission, and the proof of their growth and progress towards that goal. Data defined: factual information; especially information organized for analysis or used to reason or make decisions.
What is your level of commitment to data analysis and using data to drive planning and instruction? • Dating the data? – early stages of a relationship or courtship where couples are just finding out about each other. Assessing the partnership. • Engaged with the data? – more deeply involved; occupy fully attention; pledged to marry. • Married to the data?- a union by which the decision is made to live by legal/binding commitment.
Interview/Reflection: Sample Data Questions What is your level of comfort with using data to drive planning and instruction? What do you believe is the most meaningful way to monitor student progress?
Why are we so data-driven? Shared Leadership…Shared responsibility…shared accountability for Teaching and learning • To ensure alignment of service delivery to all children, continuity across all classrooms, and achievement in all areas of academic, social, and emotional growth • To engage stakeholders in meaningful & targeted teaching and learning • To ensure and monitor learning for all children
Data Analysis: 10 Step School Improvement Process Select Organize by categories/content Analyze (disaggregate) Compare performance (schools, classrooms, subgroups) Present to stakeholders - Display Celebrate strengths, and I.D. patterns/weaknesses Prioritize goal areas Develop School Improvement/ Grade/Subject Action Plans Develop Intervention Plans for Individual Students Monitor progress, Measure growth, and Match interventions
KNOW YOUR SCHOOL … “Courageous Conversations” Guiding Questions for Schools • How did we perform as a school compared to other schools like ours? Unlike ours? • How did we perform across subgroups (FARMS, Ethnicity, Special Needs, GT, Gender, ESOL? • How did we perform across subjects & grade levels? How did we perform across classes? • How did individual students perform?
KNOW YOUR CLASS … “Courageous Conversations” Guiding Questions for Teachers • What is the profile of your class? (demographics, performance levels of instructional groups, learning styles, motivation/cooperation, time intensive academically, time intensive socially/emotionally, independent learners, deep thinkers). • What factors in your classroom environment contribute to, or impede the overall success of your students? • Based on grade distribution data, how many of your students are performing above, on, or below grade level? What are the numbers and percentages of A’s, B’s, C’s, D’s?
KNOW YOUR CLASS … “Courageous Conversations” Guiding Questions for Teachers 4. Using at least 3 data points, what are the implications for instruction? • Are there disparities between classroom performance and district/standardized assessment results for individual students? • How did your children perform on common assessments for Math and ELA? (numbers percentages in red, yellow, and green zones)
KNOW YOUR KIDS … “Courageous Conversations” 7. Based on the analysis of your class data, respond to the Four Critical Questions below. What do you want your students to learn? (What are the patterns of strengths/ weaknesses?) How will you know when they’ve learned it? (Which data point will you use to assess progress?) What are your plans for those who didn’t learn it? (How/when will you re-teach/review? Are the red/yellow zone students receiving adequate intervention? What are your plans for those who already know it? (How/when will you enrich/accelerate? Are there extreme outliers for acceleration?) What supports, resources, and instructional aides do you need to ensure student success?
JPES Accelerated Student Data Profile 2013-2014 Williams Jas’ myne 5F Brown
JPES Core Student Data Profile 2013-2014 Samantha 1B Kahler
JPES Strategic Student Data Profile 2013-2014 Durham, Samantha 2D Gregg
JPES Intensive Student Data Profile 2013-2014 Williams Jas’ myne 3B Rollison
Building classroom learning systems… Student Data Portfolios • 2nd Grade Students at Work • Personal Goals • Math & ELA Benchmarks • SRI • DRA Levels • Writing Prompts • Student Led Conferences • Analyzing Data Points • How it all comes together
Building Classroom Learning Systems … Data displays Classroom Teachers hold data conferences with students, set goals, and create data displays in their classrooms that promote continuous growth and improvement without intruding on student privacy. *Photos of data displays will be provided for session participants.
REVISIT: What is your level of commitment to data analysis and using data to drive planning and instruction? • Dating the data? • Engaged with the data? • Married to the data?
MAKE AND TAKE YOUR OWN Teacher Data Notebooks Student Data Profile/Cards Student Data Portfolios Design a Classroom Data Display
Contact information Joseph R. Pye Elementary School 9701 Patriot Blvd Ladson, South Carolina 29456 (843) 695-2979 pes@ddtwo.org wwilliams@dorchester2.k12.sc.us rvandamme@dorchester2.k12.sc.us ssalsman@dorchester2.k12.sc.us sburke@dorchester2.k12.sc.us vgregg@dorchester2.k12.sc.us cstall@dorchester2.k12.sc.us
Session Evaluations • For each question, use 1=strongly disagree, 2=disagree, 3=agree, 4/5=strongly agree. Your responses will assist us in planning future professional development in Dorchester School District Two. • The instructor was well prepared for the workshop. • The materials for the workshop were appropriate. • The concepts presented were appropriate to my job. • I will benefit from attending this session. • I would recommend this training to others.