Download
1 / 10
100 likes | 238 Views
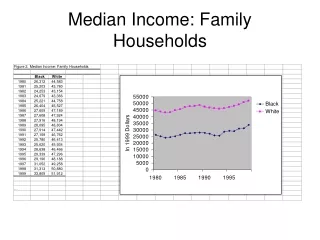
Median Family Income, 1947-97. $44,568. $40,979. $44,284. $41,051. 1947-73 +104%. 1973-97 +8.8%. $20,102. Growth in Hourly Wages, 1947-97. $13.40. $12.28. 1947-1973 +79%. 1973-1997 -8.0%. $7.49. Note: These inflation-adjusted wages are for the approximately

E N D
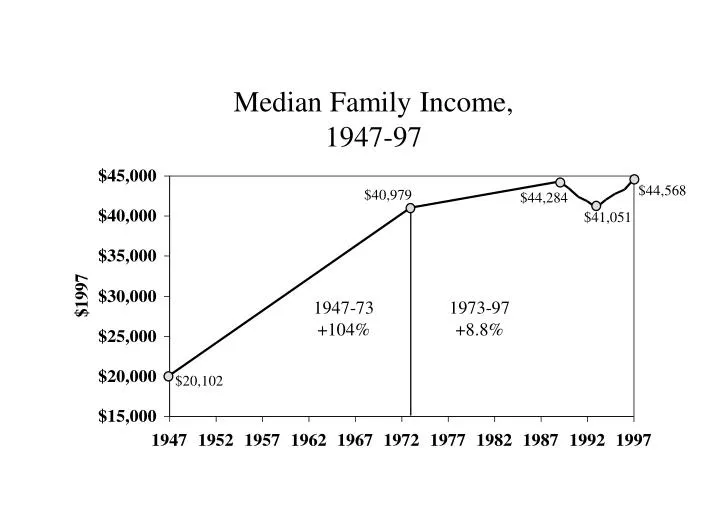
Median Family Income,1947-97 $44,568 $40,979 $44,284 $41,051 1947-73 +104% 1973-97 +8.8% $20,102
Growth in Hourly Wages,1947-97 $13.40 $12.28 1947-1973 +79% 1973-1997 -8.0% $7.49 Note: These inflation-adjusted wages are for the approximately 82% of the privately employed labor force categorized as production nonsupervisory workers.
Annual Growth in Family Incomeby Income Group 1947-73 Lower-Middle Income Group Middle Income Group Upper-Middle Income Group Poorest 20% Top20% Note: One-fifth of all families are in each income class. The one-fifth of families with the lowest incomes are in the lowest fifth; the one-fifth of families with the highest incomes are in the highest fifth, etc.
Lower-Middle Income Group Middle Income Group Upper-Middle Income Group Poorest 20% Top20% Annual Growth in Family Incomeby Income Group 1973-97 Note: One-fifth of all families are in each income class. The one-fifth of families with the lowest incomes are in the lowest fifth; the one-fifth of families with the highest incomes are in the highest fifth, etc.
Percent of Workers EarningPoverty-Level Wages,1973-1997 Women 35.3% 28.6% 28.5% All Workers 23.7% 23.5% Men 22.5% Note: A full-time year-round worker with poverty level wages earns insufficient income to lift a family of four out of poverty.
Percent of Workers EarningPoverty-Level Wages,1973-1997 46.7% Hispanics 38.2% Blacks 33.5% 32.8% Whites 24.5% 21.8% Note: A full-time year-round worker with poverty level wages earns insufficient income to lift a family of four out of poverty.
Entry Level Wages of College Graduates,1973-1997 Men $14.82 $14.89 $13.65 $13.44 Women 12.95 $12.20
Entry Level Wages ofHigh School Graduates,1973-1997 $11.10 $10.98 Men $8.34 $8.36 $7.95 Women $6.81
Change in Hourly Wages1973-1997 Men High Wage Median Wage Low Wage
Change in Hourly Wages1973-1997 Women High Wage Median Wage Low Wage