Download

1 / 18
180 likes | 272 Views
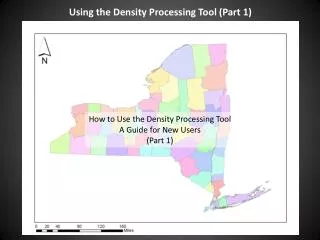
Using the Density Processing Tool (Part 1). How to Use the Density Processing Tool A Guide for New Users (Part 1). Goals of Lesson: Demonstrate how to load the ArcMap file used with the Density Processing Tool. Demonstrate how to set up the ArcMap for use with

E N D
Using the Density Processing Tool (Part 1) How to Use the Density Processing Tool A Guide for New Users (Part 1)
Goalsof Lesson: • Demonstrate how to load the ArcMap file used with • the Density Processing Tool. • Demonstrate how to set up the ArcMap for use with • the Density Processing Tool.
Before proceeding, make sure all extensions are enabled. Go to Customize – Extensions.
Ensure that all the extensions are turned on. (Each extension should have a check mark in the box by its name). If any extension is turned off, enable it by clicking the box to its left.
Open the one.mxd in the Phase 13 folder(or the folder in which the Density Processing Tool is Installed.)
Immediately save the one.mxd as a new file with a new name before making any changes to it. This will preserve the one.mxd as a backup. From this step on, only work from the new file.
The one.mxd (now saved under the new name) contains a number of layers that can be used with the density processing tool. The first four layers are reserved for future use with weigh in motion data. WIM = Reserved for future use. CCclass = Reserved for future use. CCvol = Reserved for future use. Continuous = Reserved for future use. The next four are currently available for use. TV9705 = Road network with vehicle counts. TV905Class = Roads with vehicle counts by class. TV905vol = Roads with vehicle volume only. NYS_Counties = The counties of New York State.
For density processing alone, only the NYS_Counties layer will be used. NYS_Counties = The counties of New York State.
Next, turn on the NYS_Counties layer and make adjustments to it. • Turn off all other layers – they are not needed until it is time to analyze truck traffic. • To adjust the NYS_Counties layer. • Right click on the layer in the table of contents. • 2. Go to Properties.
Adjust the NYS_Counties layer in the properties window. • To adjust the layer: • Go to the Symbology tab. • Under Categories, select Unique values, many fields. • Set the Value Fields to COUNTY. • Select a color ramp that clearlyshows each county. • Click OK.
The map should now look something like this. Or this…. As long as the counties are distinct, it doesn’t really matter.
However, being able to see the counties is not much good if we don’t know their names.
Go back to the properties window for the NYS_Counties layer. • To adjust the NYS_Counties layer. • Right click on the layer in the table • of contents. • 2. Go to Properties.
Label the counties with their individual names. • To label the counties: • Go to the Labels Tab. • Under Label Field, select COUNTY. • Adjust the font size. • Click Apply to see the labels, and then OK once they are satisfactory.
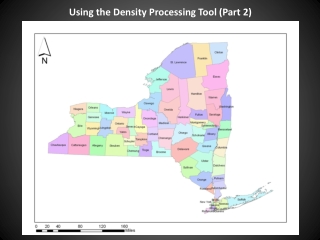
The map should now look something like this. Each county will be labeled with its name.
Now the map is ready for using the Density Processing Tool! Proceed to Part 2