Download
1 / 13
130 likes | 220 Views
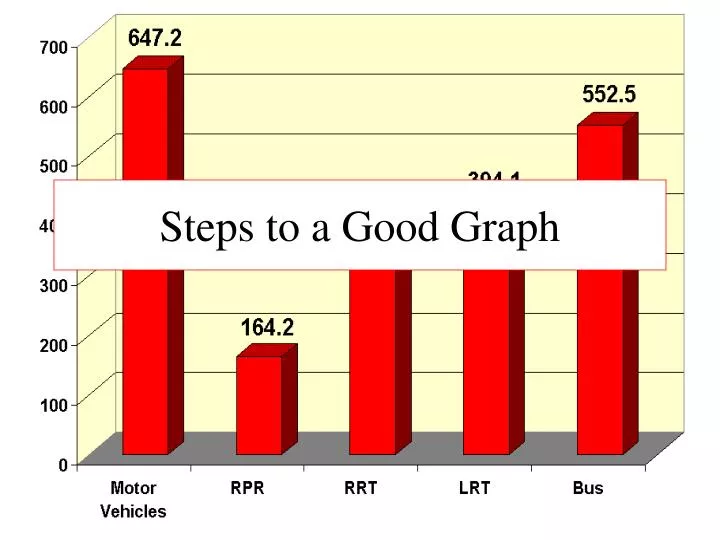
Steps to a Good Graph. Step 1- Selecting Graph Type. Line graphs compare 2 variables (temp. vs time, # living organisms vs. pH). Bar graphs are used for comparing two or more values that were taken over time or on different conditions, usually on small data sets.

E N D
Step 1- Selecting Graph Type • Line graphs compare 2 variables (temp. vs time, # living organisms vs. pH). • Bar graphs are used for comparing two or more values that were taken over time or on different conditions, usually on small data sets. • Pie charts used to show data as part of 100%. • Histographs used to show age grouping vs. # organisms in each group.
Line Graph • Independent Variable goes on the X-axis • Dependent Variable goes on the Y-axis
Bar Graph Data sets (groups being compared) on X-axis # on Y-axis
Pie Graph % out of 100%
Histograph Show how many people are living in different age groups.
Step 2 – Title your Graph • All graphs need a title explaining what you are graphing.
Step 3 – Label Your Axes • Make sure you label your X-axis with the name of the independent variable. • Label the Y-axis with the name of the dependent variable.
Step 4 – Check your Scale • Make sure that you equally space your values on the X and Y axes.
Step 5 – Draw the Graph • Make sure you connect the dots or make the bars. • If using more than 1 data set, create a key with colors or symbols.
Graphing data Why does it help analyze the results?