Download
1 / 37
370 likes | 465 Views
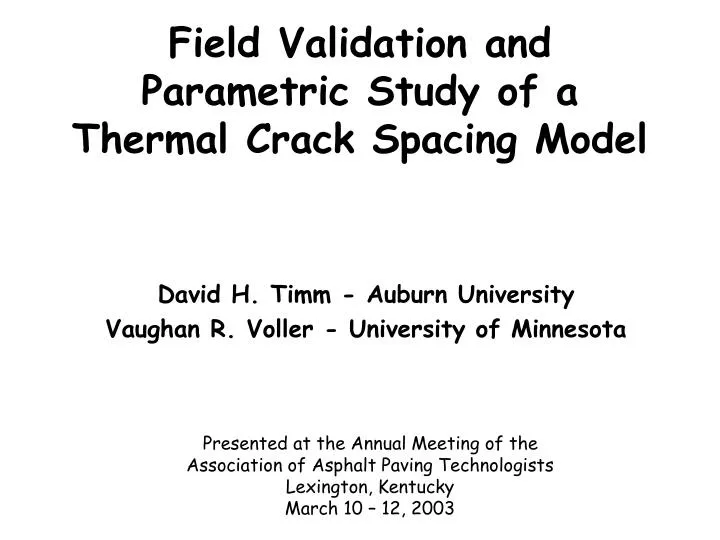
Field Validation and Parametric Study of a Thermal Crack Spacing Model. David H. Timm - Auburn University Vaughan R. Voller - University of Minnesota. Presented at the Annual Meeting of the Association of Asphalt Paving Technologists Lexington, Kentucky March 10 – 12, 2003.

E N D
Field Validation and Parametric Study of a Thermal Crack Spacing Model David H. Timm - Auburn University Vaughan R. Voller - University of Minnesota Presented at the Annual Meeting of the Association of Asphalt Paving Technologists Lexington, Kentucky March 10 – 12, 2003
Cracking Characteristics • Thermal cracking common in cold climates • Features • Transverse cracks • Regular spacing
Crack Spacing Focus of this Study is the question What features control the spaces between Cracks?
E, n, r, H, a E, n, r, c, f Model Stress Profile in Thermally Cooled Asphalt Layer on Granular Base Modeled in Two ways
Finite Difference Code--FLAC Grid Element Sizes Asphalt Concrete (Elastic Model) 50x250 mm 63x315 mm 313x1563 mm Granular Base (Mohr Coulomb Model) z x
1-D Semi-Analytical ModelElastic Layer with Elastic-Plastic Restraint q=kux t=ca+stanf xt Timm, Guzina and Voller Int J Solids and Structures, 2002
Form of Stress Profile Rate of Strees Increase Curling Stress Distance from free end
Crack Spacing from Stress Curve Sliding On Rigid Base s1 St x Cracking will not occur xc Cracking may occur
Crack Spacing from Stress Curve xc xc Average Spacing = 1.5·Xc s1 St x
Objectives • Validate thermal crack spacing model with field data • Perform sensitivity analysis on length scale • Help guide future laboratory work • Develop more complete understanding • Identify how material selection will affect spacing
E, n, r, H, a E, n, r, c, f Scope • Field Validation • 4 similar sections at Mn/ROAD • Parametric Study • 10 input variables • Layer 1 • Stiffness, Poisson, Density, Thickness, Thermal Coef. • Layer 2 • Stiffness, Poisson, Density, Cohesion, Friction Angle
Field Validation Methodology • Select MnROAD sections • Analyze thermal crack spacing by section • Analyze in situ thermal conditions • Gather material property data for model • Simulate pavement, determine spacing • Compare predictions to measured • Assess validity
Cell 1 Cell 2 Cell 3 Cell 4 0 150 155 160 231 200 102 102 400 Depth Below Pavement Surface, mm 838 600 711 838 LEGEND HMAC 800 Class 6 G.B. Class 5 G.B. Class 4 G.B. 1000 Class 3 G.B. 1200 MnROAD Sections • Similar thickness designs • Identical binders • Common subgrade • Different base layers
Average Crack Spacing Avg Spacing Cell 1: 12 m Cell 2: 8 m Cell 3: 13 m Cell 4: 9 m
Bottom of pavement Feb 2 Feb 1 Feb 3 Top of pavement Temperature Cycling
E, n, r, H, a E, n, r, c, f Material Property Data • Backcalculation • Laboratory testing as part of Mn/ROAD project • Derived values • Thermal coefficient = fn (Volumetrics) • Model ‘tuned’ with friction and cohesion
Resulting Friction and Cohesion Mohr-Coulomb Properties of Material Directly Beneath HMA
16 Cell 3 14 12 Cell 1 10 Predicted Spacing, m 8 Cell 4 Cell 2 6 Line of Equality 4 2 0 0 2 4 6 8 10 12 14 16 Measured Average Spacing, m ModelComparison
Model Assessment • Crack spacings pass reasonableness check • Recently, model has been used to predict other crack spacing phenomenon TiN Coating
Factors that Influence Stress Profile Rate of Stress Increase Max stress Curling Stress
Parametric Investigation Methodology • Uniform temperature change • 2-layer structure • 10 input parameters varied from low, medium, and high • Maximum tensile stress curves plotted and evaluated • Maximum Stress • Rate of Stress Increase • Curling Stress
Base Cohesion (c2) As c gets Large Only elastic resistance
Base Friction Angle (f2) Note: c = 10 kPa
Factors that Influence Stress Profile Rate of Stress Increase Max stress Curling Stress
Conclusions • Model compared favorably to field data • Model is sensitive to base material properties • Model is simple, yet provides length scale to thermal cracking problem • Key input parameters are… • Stiffnesses of HMAC and Base • Thermal coefficient • Frictional properties of Base material
Recommendations • Further validation with field sections • Model has compared favorable to other types of cracking • Incorporate a fracture mechanics model to simulate crack propagation • Examine viscoelastic constitutive models
Potential Uses of Model • Plan mitigation strategies • Saw and seal • Material selection • Assess probability and expectation of cracking
Acknowledgements • Dr. Bojan Guzina • Minnesota Department of Transportation • Minnesota Road Research Project
Thank You! Questions?