Download
1 / 13
130 likes | 231 Views
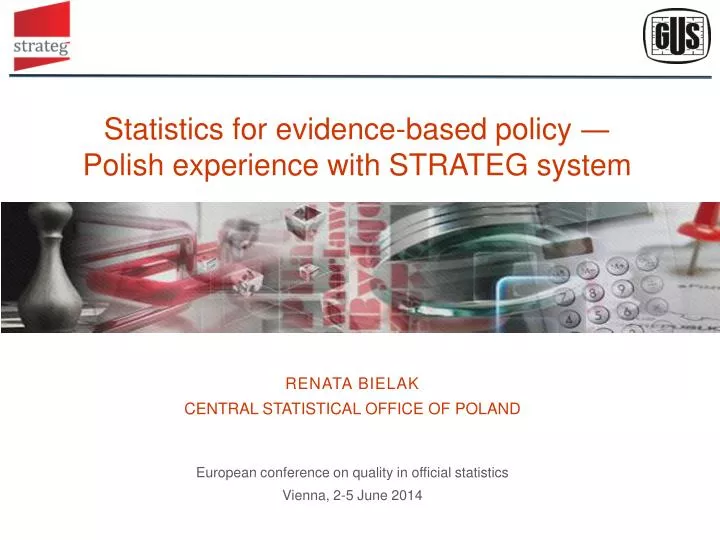
Statistics for evidence-based policy ― Polish experience with STRATEG system. RENATA BIELAK CENTRAL STATISTICAL OFFICE OF POLAND. European conference on quality in official statistics Vienna, 2-5 J une 2014. Introduction. STRATEG - system for development monitoring

E N D
Statistics for evidence-based policy ―Polish experience with STRATEG system RENATA BIELAK CENTRAL STATISTICAL OFFICE OF POLAND European conference on quality in official statistics Vienna, 2-5 June 2014
Introduction • STRATEG - system for development monitoring • Created by Central Statistical Office (in cooperation with the Ministry of Regional Development) • Publicly available at: strateg.stat.gov.pl • January 2015 – launch of the English version • Basic characteristics • Database with over 3 million records • Data visualisation tools: tables, charts and maps • Statistical education – information on indicators
Range of theinformation (1) Indicators used for monitoring of strategies and cohesion policy
Range of theinformation (2) • Annualdata (starting from 2003) • Over 80 data sources (official statistics as well as other national and international data sources) national monitoring atfollowingterritoriallevels: ― country, ― lowerspatialaggregationlevels(NUTS 2,3, LAU 1,2), ― functionalareas (e.g. Eastern Poland) international comparisons (theEU, Member States and NUTS2)
Europe 2020 – monitoring of progress Target value Base value
Visualisationtools (1) - charts • Flexibility of settings • Animated charts
Basic settings Cartogram classification settings Cartogram colour settings Cartodiagram settings Cartodiagram classification settings Other Visualisationtools (2) - maps Close • User’s panel with variety of options, i.e. customisation of: • intervals • colours • territorial levels • Export to png, jpeg
Visualisationtools (3) - maps Presentation of twoindicators
Statistical education Metadata & analyses
Summary • System created to improve the process of programming and monitoring of development • Main users: policymakers, government authorities • Indicators for measuring of progress and policymaking • Easy data analysis • Tool for communication with users and statistical education • Information on indicators • Variety of options, functionalities • User-friendly layout and intuitive usability • Project under constant development
ENJOY STRATEG! RENATA BIELAK r.bielak@stat.gov.pl