Download
1 / 17
190 likes | 374 Views
Sample Spaces, Subsets and Basic Probability. CCM2 Unit 6: Probability. Sample Space. Sample Space: The set of all possible outcomes of an experiment. List the sample space, S, for each of the following: a. Tossing a coin S = {H,T} b. Rolling a six-sided die S = {1,2,3,4,5,6}

E N D
Sample Spaces, Subsets and Basic Probability CCM2 Unit 6: Probability
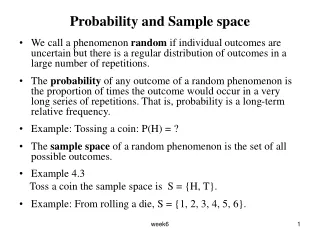
Sample Space • Sample Space: The set of all possible outcomes of an experiment. • List the sample space, S, for each of the following: a. Tossing a coin • S = {H,T} b. Rolling a six-sided die • S = {1,2,3,4,5,6} c. Drawing a marble from a bag that contains two red, three blue and one white marble • S = {red, red, blue, blue, blue, white}
Intersections and Unions of Sets • The intersection of two sets (A B) is the set of all elements in both set A AND set B. • The union of two sets (A B) is the set of all elements in set A OR set B. • Example: Given the following sets, find A B and A B A = {1,3,5,7,9,11,13,15} B = {0,3,6,9,12,15} A B = {3,9,15} A B = {0,1,3,5,6,7,9,11,12,13,15}
Venn Diagrams • Sometimes drawing a diagram helps in finding intersections and unions of sets. • A Venn Diagram is a visual representation of sets and their relationships to each other using overlapping circles. Each circle represents a different set.
Use the Venn Diagram to answer the questions below: Factors of 12 1 6 12 2 4 Factors of 16 8 16 A B • What are the elements of set A? {1,2,3,4,6,12} • What are the elements of set B? {1,2,4,8,16} 3. Why are 1, 2, and 4 in both sets?
Factors of 12 1 6 12 2 4 Factors of 16 8 16 A B 4. What is A B? {1,2,4} 5. What is A B? {1,2,3,4,6,8,12,16}
In a class of 60 students, 21 sign up for chorus, 29 sign up for band, and 5 take both. 15 students in the class are not enrolled in either band or chorus. 6. Put this information into a Venn Diagram. If the sample space, S, is the set of all students in the class, let students in chorus be set A and students in band be set B. 7. What is A B? 8. What is A B?
S. Students in the class 15 B. Students in Band 24 A. Students in Chorus 5 16 A B = {45} A B = {5}
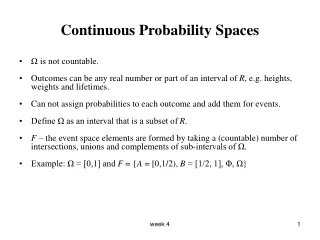
Compliment of a set • The complement of a set is the set of all elements NOT in the set. • The compliment of a set, A, is denoted as AC • Ex: S = {…-3,-2,-1,0,1,2,3,4,…} A = {…-2,0,2,4,…} If A is a subset of S, what is AC? AC = {-3,-1,1,3,5,…}
S. Students in the class 15 B. Students in Band 24 A. Students in Chorus 165 • What is AC? BC? {39} {31} • What is (A B)C? {55} • What is (A B)C? {15}
Basic Probability • Probability of an event occurring is: P(E) = Number of Favorable Outcomes Total Number of Outcomes • We can use sample spaces, intersections, unions, and compliments of sets to help us find probabilities of events. • Note that P(AC) is every outcome except (or not) A, so we can find P(AC) by finding 1 – P(A) • Why do you think this works?
An experiment consists of tossing three coins. • List the sample space for the outcomes of the experiment. {HHH, HHT, HTH, HTT, THH, THT, TTH, TTT} • Find the following probabilities: • P(all heads) 1/8 b. P(two tails) 3/8 • P(no heads) 1/8 • P(at least one tail) 7/8 • How could you use compliments to find d? The compliment of at least one tail is no tails, so you could do 1 – P(no tails) = 1 – 1/8 = 7/8
A bag contains six red marbles, four blue marbles, two yellow marbles and 3 white marbles. One marble is drawn at random. • List the sample space for this experiment. {r, r, r, r, r, r, b, b, b, b, y, y, w, w, w} • Find the following probabilities: a. P(red) 2/5 b. P(blue or white) 7/15 c. P(not yellow) 13/15 (Note that we could either count all the outcomes that are not yellow or we could think of this as being 1 – P(yellow). Why is this?)
A card is drawn at random from a standard deck of cards. Find each of the following: • P(heart) 13/52 or ¼ 17. P(black card) 26/52 or ½ 18. P(2 or jack) 8/52 or 2/13 19. P(not a heart) 39/52 or 3/4
Odds • The odds of an event occurring are equal to the ratio of favorable outcomes to unfavorable outcomes. Odds = Favorable Outcomes Unfavorable Outcomes
20. The weather forecast for Saturday says there is a 75% chance of rain. What are the odds that it will rain on Saturday? • What does the 75% in this problem mean? • In 100 days where conditions were the same as Saturday, it rained on 75 of those days. • The favorable outcome in this problem is that it rains: • 75 favorable outcomes, 25 unfavorable outcomes • Odds(rain) = 75/25 or 3/1 • Should you make outdoor plans for Saturday?
21. What are the odds of drawing an ace at random from a standard deck of cards? Odds(ace) = 4/48 = 1/12