Download
1 / 34
350 likes | 527 Views
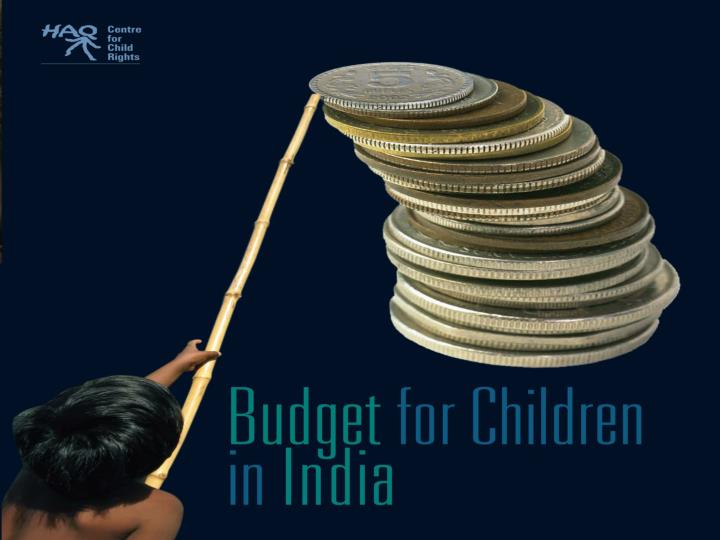
WHY BUDGET ANALYSIS? Budget is not merely an economic document but an indicator of nation’s priorities and intent. It is a political statement…. WHAT IS BUDGET for Children (BfC)?

E N D
WHY BUDGET ANALYSIS? Budget is not merely an economic document but an indicator of nation’s priorities and intent. It is a political statement…
WHAT IS BUDGET for Children (BfC)? Budget for children is not a separate budget. It is an attempt to disaggregate from all allocations made, those made specifically for children.
Why should we give priority attention to children in India? • Nineteen per cent of world’s children live in India. They comprise 42 per cent of the country’s total population. In international comparisons of the status and condition of children, India continues to rank poorly on several key counts. Children still suffer from poor nutrition, inadequate health services, clean water, sanitation and basic education. • Children are voiceless and are at a particularly vulnerable stage of life. They do not form a powerful political lobby, and cannot advocate for themselves for more effective delivery of socio-economic services that meet their needs. Thus, the lack of a detailed assessment of how much the government is spending on children inhibits the effective improvement of basic living standards of children. • Budgetary programmes, specifically socio-economic expenditures, affect the well-being and life opportunities of children directly. • The well being of the society depends on the investment in its human resource development, particularly development of children and the youth.
“State parties shall undertake such measures to the maximum extent of available resources and where needed the framework of international cooperation” Article 4, UNConvention on the Rights of the Child India has ratified the United Nations’ Convention on the Rights of the Child in 1992 and has thus promised to place Children's Rights at the forefront of development. It promised to give greater priority to children’s concerns than was being given before as part of all its developmental programmes
BfC AT TWO LEVELSUNION AND STATES • ANALYSIS AT BOTH LEVELS IS NECESSARY TO COMPREHENSIVELY GAUGE THE GOVERNMENTS’ COMMITMENT TO CHILD RIGHTS • POLICY MAKING, PLANNING AND ALLOCATION OF FUNDS --AT BOTH LEVELS • FLOW OF FUNDS – FROM UNION TO STATES
Question Before Us What is the situation of children in India that needs to be addressed with “available resources”? More importantly, are the resources being allocated and spent “adequate”?
BUDGETfor children A STUDY BY HAQ: Centre For Child Rights • First phase-2001 HAQ undertook a decadal analysis 1990-2000 • Second phase -States of (Orissa, Andhra Pradesh and Himachal Pradesh) apart from the Union Budget • Currently- AP, HP, UP and Assam, West Bengal • Union Budget through out….
Government of India has adopted Child Budget as its mandate • MWCD includes a chapter in its Annual Report each year • On October 26, 2005 in a meeting of State Secretaries organised by the Ministry of Women and Child Development, the government promised that it would henceforth undertake Child Budgeting. • Included in the National Plan of Action for Children 2005 • Included in draft Chapter of the Eleventh Plan Document
Average Allocation (BE) on Children in Union Budget (2000-01 to 2006-07) Of every Rs. 100 allocated to the Union Budget an average of Rs. 3.10 has been allocated to the children during 2000-01 to 2006-07
The difference in the budget estimates and revised estimates shows how the budget undergoes a change in the middle of the financial year. The actual expenditure is the reflection of the implementation of any programme as envisaged in the beginning of the year. Our earlier (decadal) analysis in 2000 had shown that the actual expenditure was almost always less than the estimates.
Between 2000-01 and 2004-05 the actual spending has been less than the budget estimates The increase of AE over BE in 2004-05 is due to 24.13 per cent increase of actual expenditure in budget for the education sector and 14.23 per cent increase of expenditure in the development sector. This is due to large investment in the flag ship programmes – the Sarva Shiksha Abhiyan following amendment to the constitution; Mid-day meal and ICDS schemes following large scale political protest and Supreme Court orders.
Share of Children in Different Sectors in the Union Budget(In percentage) Source: Detailed Demands for Grants, Ministry of HRD, Ministry of SJ&E, Ministry of Labour, Ministry of Health and Family Welfare and Ministry of Women and Child Development (2000-01 to 2006-07)
Average Sectoral Allocation as Percentage of BfC 2000-01 to 2006-07 (In per cent) Of every Rs 100 within the budget for children, Rs 63.09 has been provided for education, Rs 19.31 for health, Rs 16.62 for development and 0.99 paise for protection.
What do we see? • BfC as a whole shown an average growth of 25.4 per cent over the seven-year period. • Within BfC, there is a growth of 18 per cent in the health sector and 18.3 per cent in protection. • The development and education sectors record an average growth of 27.3 and 28.2 respectively.
At first glance, this growth appears to be fairly impressive. Closer scrutiny however, reveals several unpalatable details…. • In 2001-02, 2002-03 and 2004-05, allocation for three sectors of the budget for children was actually reduced significantly. • In 2001-02, Budget Estimates for the health sector were reduced by 4 per cent in comparison to the previous year. • In 2003-04, the protection sector shows a negative annual growth of 7.2 per cent. • Development sector records a reduction of as much as 8.4 per cent in 2004-05.
Children’s health and protection needs have been largely neglected during the period of this study. In the wider context of poverty, disease-prevalence, malnutrition, high mortality and the increase in the number of children coming into conflict with the law, can the neglect of children’s health and protection requirements – in financial terms – be justified?
Sectoral Difference in BE, RE and AE in Child Budget(In per cent)
Health has the highest under spending in BfC- 22.41 This is due to under spending of 22.27 per cent in RCH Programme (Including National Immunisation programme) Remember- RCH constitutes 95 per cent of total health sector allocation for children. • Protection has the lowest allocation and shows 15.22 per cent under spending (AE-BE).
Dependence on External Aid • As much as 24.1 per cent of the allocations for children is through external financing • The financial dependence on external sources has increased from 19.18 per cent in 2000-01 to over 28.4 per cent in 2003-04, falling to about 22 per cent in 2005-06. • If analysed sectorally, 11.4 per cent of the allocations for child development, 19 per cent of education and 51 per cent of health is from external sources. • This high dependence on external financing has to be seen against the fact that debt servicing as a proportion of gross external current receipts are 10 per cent and India has been eighth in position among the ten debtor countries in 2004. • This does not include funding support received for protection sector, since the funding for Child labour elimination programmes, that receive external funding are through direct partnerships between the funding bodies and implementing agencies or state governments & do not find reflection the budget of the National Government (Union Budget).
Budget 2007-08 • The Finance Minister either seems to have forgotten has chosen to omit a mention child budget despite Govt’s own commitment. • The allocation for child health has fallen from 0.55 per cent in 2007-08 to 0.48 percent this year. It is even less than what was allocated two years ago i.e. in 2005-06 (0.52 percent). As it is, 80 per cent of the total health care costs are met through private expenditure and most of the private expenditure is out-of-pocket (nearly 97 per cent). It is therefore imperative to ask what impact this fall in allocation for child health will have on a family’s expenses?
There is an increase of Rs. 673.46 crore in the allocation promised by the Finance Minister for ICDS. However, this is still not enough to meet the Supreme Court’s directives of universalisation of ICDS in all 17 lakh habitations. There was already a short fall of 8.2 lakh Anganwadi centres at the beginning of 2007-08 with only 8.8 lakh operational Anganwadi centres. An additional allocation of Rs. 673 crore is certainly not enough to meet this requirement.
The minimal increase of 0.01 per cent that we see in protection of children is largely due to introduction of the much-awaited Integrated Child Protection Scheme (ICPS) that has been introduced in the current budget with an allocation of Rs. 85.5 crore. Child protection constitutes 0.04 per cent of total Union Budget 2007-08. • While the Parliament passed the National Commissions for Protection of Child Rights Bill in 2006, there is nothing in the budget speech to suggest how it is to be implemented? Where are the resources for the Commissions going to come from? Hope it is not part of the ICPS as that will further reduce the budget for programmatic intervention on justice and protection for children.
While the total allocation for education has increased by 34 per cent this year, the share of child education (elementary and secondary education) has only gone up by 21.34 percent. • The increase of 10.26 percent in allocation for elementary education is primarily due to the increase in the budget for mid-day meal scheme, resulting from a higher investment of the amount collected through the education cess. As regards SSA and DPEP, government’s flagship programmes on universalisation of elementary education, there is actually a fall in the allocation. • Despite a seemingly visible commitment towards education, the Finance Minister seems to have reduced the government’s share (other than education cess) in the allocation for SSA. The allocation promised for SSA from sources other than the education cess was Rs. 5169 crore in 2006-07. But in 2007-08, it has been cut down to only Rs. 3678 crore.
Table 1 Budget for Children as percentage of the State Budget and Sectoral Allocation within BfC as percentage of the State Budget State Budget for Children as percentage of the State budget Sectoral allocation within BfC as percentage of the State Budget Development Health Education Protection 2000-01 to 2005-06 Andhra Pradesh 12.27 0.54 1.5 10.1 0.16 Himachal Pradesh 14.5 0.49 0.17 13.77 0.07 Orissa* 13.25 1.33 0.14 11.75 0.03 2004-05 to 2007-08 Assam 8.79 0.67 0.13 7.99 0.01 West Bengal 13.12 1.17 0.36 12.61 0.03 Himachal Pradesh 15.01 0.63 0.01 14.3 0.07 Andhra Pradesh 13.58 1.84 0.18 11.44 0.15 Note: * The duration for the study in Orissa was 2001-02 to 2005-06 Source: Detail Demands for Grants of various concerned Departments, for the years mentioned in the table, Government of HP, AP, Orissa, Assam and West Bengal.
West Bengal Out of every 100 Rupees On an average Rs. 13 Rupees and 12 paise was allocated for children
Year Himachal Pradesh Orissa Andhra Pradesh BE-RE BE-AE BE-RE BE-AE BE-RE BE-AE 2000-01 -0.1 0.43 2001-02 -0.2 -2.51 + 7.5 + 3.2 2.621 7.132 2002-03 -1.45 0.26 - 0.1 - 6.5 5.549 16.329 2003-04 2.53 -4.03 + 1.8 - 8.2 12.607 14.678 2004-05 -0.72 N.A +3.5 NA 3.000 NA Difference in BE, RE & AE in BfC in the States(In Per cent)