Download
1 / 2
30 likes | 124 Views
S. S. N. n.t.s. R1. R1. R1. 40. S. R1. G. STREET: PVDE. Traffic Engineering Survey City of Rancho Palos Verdes. LIMITS: 2,900 ft n/o PVDS – Crest Rd (SHEET 2 OF 3). DATE: 9-10-07. ENGINEER: JACK RYDELL. SIGNATURE:. MAP SYMBOLS. (sheet 1 limits). San Ramon Dr. SCHOOL.

E N D
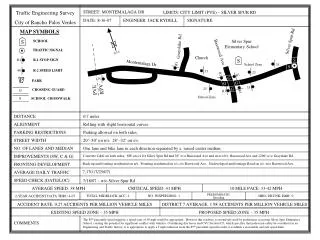
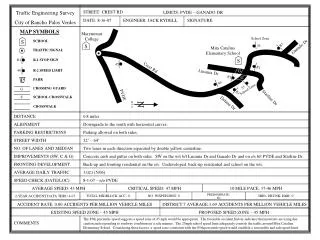
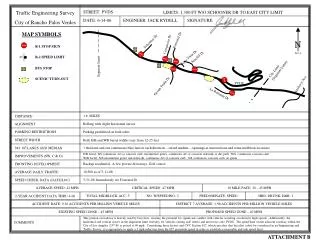
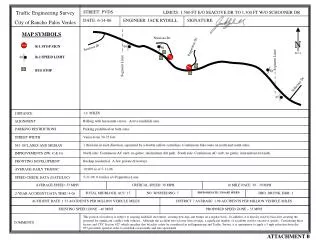
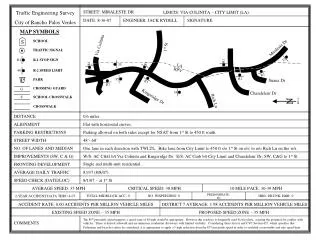
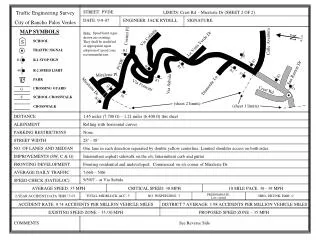
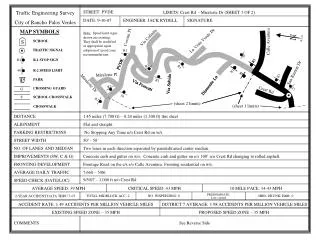
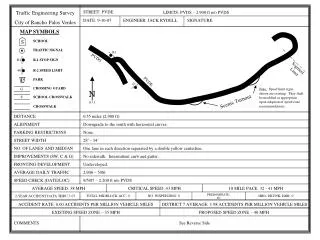
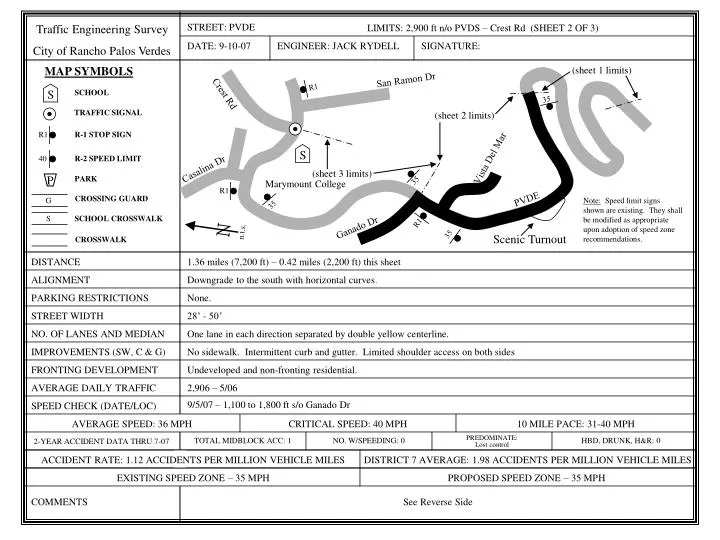
S S N n.t.s. R1 R1 R1 40 S R1 G STREET: PVDE Traffic Engineering Survey City of Rancho Palos Verdes LIMITS: 2,900 ft n/o PVDS – Crest Rd (SHEET 2 OF 3) DATE: 9-10-07 ENGINEER: JACK RYDELL SIGNATURE: MAP SYMBOLS (sheet 1 limits) San Ramon Dr SCHOOL Crest Rd 35 TRAFFIC SIGNAL (sheet 2 limits) R-1 STOP SIGN Vista Del Mar R-2 SPEED LIMIT Casalina Dr (sheet 3 limits) PARK 35 P Marymount College PVDE CROSSING GUARD Note: Speed limit signs shown are existing. They shall be modified as appropriate upon adoption of speed zone recommendations. 35 SCHOOL CROSSWALK Ganado Dr 35 Scenic Turnout CROSSWALK DISTANCE 1.36 miles (7,200 ft) – 0.42 miles (2,200 ft) this sheet ALIGNMENT Downgrade to the south with horizontal curves. PARKING RESTRICTIONS None. STREET WIDTH 28’ - 50’ NO. OF LANES AND MEDIAN One lane in each direction separated by double yellow centerline. IMPROVEMENTS (SW, C & G) No sidewalk. Intermittent curb and gutter. Limited shoulder access on both sides FRONTING DEVELOPMENT Undeveloped and non-fronting residential. AVERAGE DAILY TRAFFIC 2,906 – 5/06 9/5/07 – 1,100 to 1,800 ft s/o Ganado Dr SPEED CHECK (DATE/LOC) AVERAGE SPEED: 36 MPH CRITICAL SPEED: 40 MPH 10 MILE PACE: 31-40 MPH TOTAL MIDBLOCK ACC: 1 NO. W/SPEEDING: 0 PREDOMINATE: Lost control HBD, DRUNK, H&R: 0 2-YEAR ACCIDENT DATA THRU 7-07 ACCIDENT RATE: 1.12 ACCIDENTS PER MILLION VEHICLE MILES DISTRICT 7 AVERAGE: 1.98 ACCIDENTS PER MILLION VEHICLE MILES EXISTING SPEED ZONE – 35 MPH PROPOSED SPEED ZONE – 35 MPH COMMENTS See Reverse Side
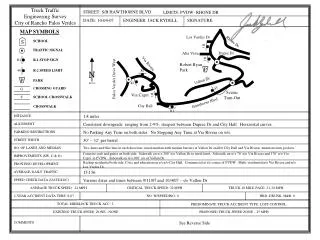
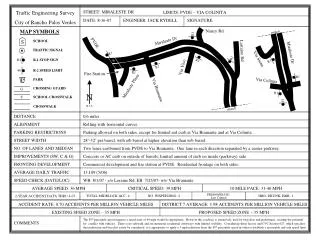
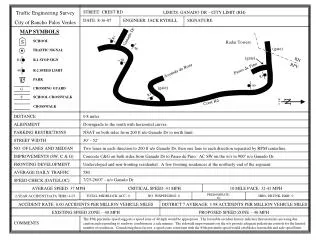
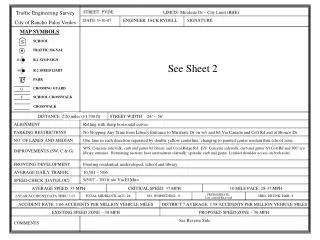
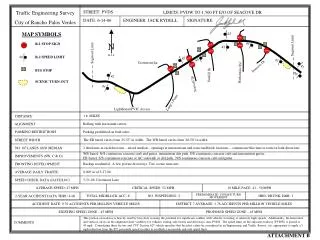
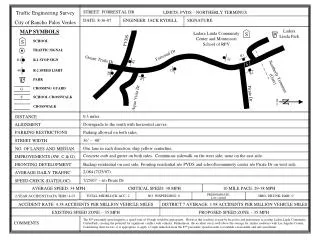
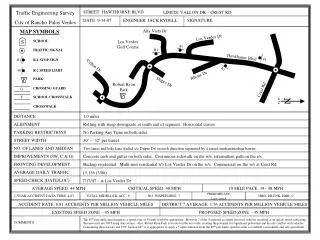
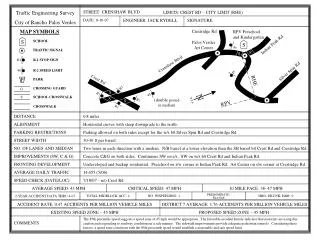
STREET: PVDE Traffic Engineering Survey City of Rancho Palos Verdes LIMITS: 2,900 ft n/o PVDS – Crest Rd (SHEET 2 OF 3) PROPOSED SPEED ZONE – 35 MPH • Comments: • The segment of roadway shown on sheets 1-3 is generally characterized by one travel lane in each direction with no fronting development. The middle portion of the segment has large horizontal curves and a downgrade to the south. This middle portion of the segment is detailed on this sheet (sheet 2 of 3). The remaining two portions are detailed on sheets 1 and 3. The southern portion consists of Palos Verdes Drive East within the switchbacks, while the northern portion begins at Ganado Drive and ends at Crest Road. • This segment of roadway has been evaluated in three parts because all of the portions are less than 0.5 miles long. The California Manual of Uniform Traffic Control Devices (MUTCD), which is authorized by the California Vehicle Code (CVC) as the legal procedure for establishing speed zones, states that speed zones should not be less than 0.5 miles in length (see pages 2B-8 and 2B-10). Therefore, shorter portions must be combined into longer segments. In addition to the above MUTCD requirement, short speed zones are not appropriate due to their adverse effect on traffic safety by: • Increasing motorist confusion and potentially unexpected driver behavior due to changing traffic regulations; • Hampering enforcement efforts by issues associated with speed limit boundaries; and, • Increasing the potential for motorists to drive at different speeds, which increases conflict and accident potential. • One radar speed measurement was taken for this portion of the segment, with the 85th percentile speed suggesting that a speed zone of 40 mph would be appropriate. However this roadway is very narrow, has limited shoulder area with no defined bike lane and is extensively used by bicyclists, creating the potential for substantial conflict with vehicles. There is no sidewalk. Considering these factors and CVC Section 627, which specifies that pedestrian and bicyclist safety be considered when determining a speed limit, it is appropriate to apply a 5 mph reduction from the 85th percentile speed in order to establish a reasonable and safe speed limit. • Each of the other two portions of this segment support a 35 mph speed limit (see sheets 1 and 3), thereby resulting in a consistent 35 mph speed limit between 2,900 feet north of Palos Verdes Drive East (the southern limit of the switchbacks) and Crest Road. This combined segment (sheets 1-3) has a length of approximately 1.36 miles and is appropriate under MUTCD procedures. Therefore, it is recommended that a 35 mph speed zone be established for this segment.