Download
1 / 15
150 likes | 300 Views
Representing Motion in Graphs. Distance – Time Speed - Time. Plotting distance against time can tell you a lot about motion. Let’s look at the axes:. Time is always plotted on the x-axis (bottom of the graph). The Further to the right on the axis, the longer the time from the start.

E N D
Representing Motion in Graphs Distance – Time Speed - Time
Plotting distance against time can tell you a lot about motion. Let’s look at the axes: Time is always plotted on the x-axis (bottom of the graph). The Further to the right on the axis, the longer the time from the start. Distance is plotted on the y-axis (side of the graph). The Higher up the graph, the further from the start.
What does the following graph represent? Distance (m) Distance (m) Time (s) Time is increasing to the right, but its distance does not change. It is not moving. We say it is AT REST.
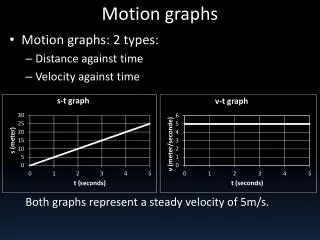
What does the following graph represent? Distance (m) Time (s) Time is increasing to the right, and distance is increasing constantly With time. The object moves at a CONSTANT SPEED.
What does the following graph represent? Distance (m) Time (s) A steeper line (dotted line) indicates a larger distance moved In a given time. In other words, HIGHER SPEED. Both lines are straight, so both speeds are constant.
What does the following graph represent? Distance (m) Time (s) The speed of the car is Constant; Returning to Start.
What does the following graph represent? Distance (m) Time (s) The line on this graph is curing upwards. This shows an INCREASE IN SPEED, since the line is getting steeper.
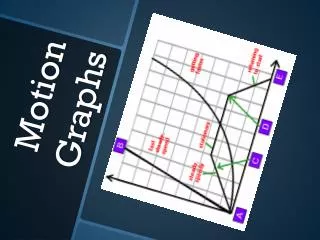
Describe the following graph: A B Distance (m) D C E Time (s) A = FAST, steady speed B = getting faster C = steady speed D = stationary; AT REST E = returning to start
Speed Vs. Time graphs look much like Distance Vs. Time graphs. Be sure to read the labels!! Time is plotted on the X-axis. Speed or velocity is plotted on the Y-axis
What does the following graph represent? Speed (m/s) Time (s) A straight horizontal line on a speed – time graph means that speed is CONSTANT. It is not changing over time. A straight line does not mean that the object is not moving!
What does the following graph represent? Speed (m/s) Time (s) This graph shows increasing speed. The moving object is ACCELERATING
What does the following graph represent? Speed (m/s) Time (s) Both the dashed and solid line show increasing speed. Both lines reach the same top speed, but the solid one takes longer. The dashed line shows a GREATER ACCELERATION.
What does the following graph represent? Speed (m/s) Time (s) The graph shows decreasing speed. The moving object is DECELERATING. Example: Car braking from 60 mph to rest (0)
What does the following graph represent? Speed (m/s) Time (s) ACCELERATION INCREASING Example: The space shuttle at lift off
Describe the following graph: C Speed (m/s) B D A Time (s) A = Steady Acceleration B = Steady Speed C = Gradual Acceleration D = Steady Deceleration