Download
1 / 39
391 likes | 541 Views
Children’s Health, Safety and Education: The Diversity of Rhode Island’s Children. Family and Community. Child Population.

E N D
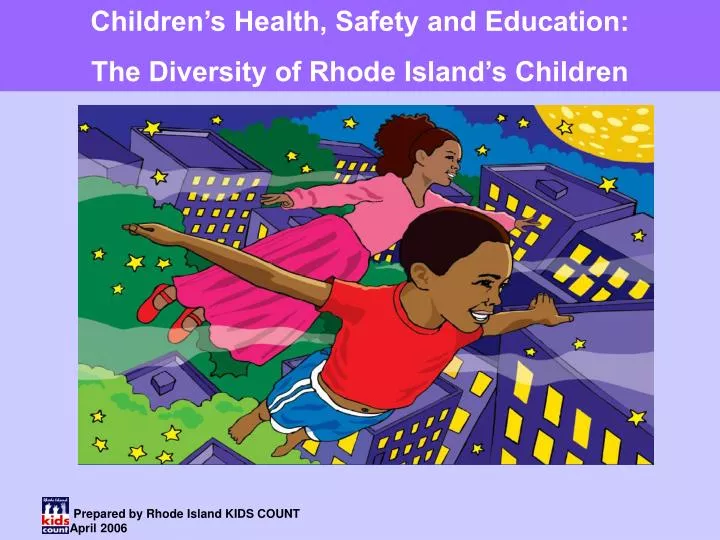
Children’s Health, Safety and Education: The Diversity of Rhode Island’s Children
Child Population • According to the American Community Survey, 2004, there are 243,667 children under age 18 in Rhode Island, representing 23% of the state’s population, down from 24% in 2000. • The largest increase in the population birth to 19 between 2000 and 2004 was led by minority children. • The U.S. Census Bureau projects that children under age 18 as a percentage of Rhode Island’s total population will decrease from 24% in 2000 to 22% in 2030.
The Diversity of Rhode Island’s Children Minority Population of Children in Rhode Island’s Core Cities Central Falls 3,957 (72%) Providence 34,419 (76%) Newport 1,714 (33%) West Warwick 840 (13%) Pawtucket 8,061 (44%) Woonsocket 3,879 (35%) • According to the Census 2000, more than three quarters (78%) of all minority children live in one of the six core cities. • According to the American Community Survey, in 2004, 30% of Rhode Island’s children are racial and ethnic minorities. • The number of Latino children has increased, from 35,000 in 2000 to nearly 40,000 in 2004, a 14% increase. This increase follows a significant shift in the Latino child population between 1990 and 2000 when the number of Latino children increased by 117%. In 2004, 17% of Rhode Island’s children were Latino.
Immigrant Children in Rhode Island • In 2004, Rhode Island was home to 9,437 foreign-born children under the age of 18 who were born outside of the United States, 4% of all children in the state. These numbers are likely to be an underestimate as immigrant children are among the most likely to be undercounted by population estimates. • Of the 9,437 foreign-born children, 45% come from Latin America, 23% from Asia, 13% from Africa, 11% from Europe, 7% from Canada and 2% from Mexico. • Immigrant families are generally poorer than native families. While immigrant families are more likely than native families to include two parents and just as likely to include full-time workers, immigrants tend to earn lower wages than U.S. natives, leading to lower household income. • In Rhode Island, 43% of children in immigrant families live below 200% of the federal poverty threshold compared with 30% of children in U.S.-born families.
Children in Single Parents Children in Single-Parent Families by City (Gross Number and as a Percent of Total): Central Falls: 2,370(48%) Newport: 2,112 (44%) Pawtucket: 6,988 (42%) Providence: 20,546 (51%) West Warwick: 1,983 (33%) Woonsocket: 4,707 (46%) • In 2004, 82,847 or 34% of children lived with a single parent, compared to 27% in 2000, a 23% increase. • In 2004, 86% of all poor children in Rhode Island lived in a single-parent family. • Single-parent Black and Hispanic families in 2004 were at least five times more likely than White and Asian families to live below the federal poverty threshold.
Mother’s Education Level • In Rhode Island between 2000 and 2004, 44% of infants were born to mothers with a high school diploma or less. • Between 2000 and 2004, 25% of births in the core cities were to mothers with less than a high school diploma. The highest rate (38%) was in Central Falls, followed by Providence (27%), Woonsocket (25%), Pawtucket (21%), Newport (19%) and West Warwick (15%).
Infants Born at Highest Risk • There are three important social and economic risk factors present at birth that, when combined, strongly predict childhood poverty and poor education outcomes – having a mother who is younger than 20, unmarried and without a high school degree. • In 2004, 5% of babies were born to Rhode Island women who were under age 20, unmarried and had less than 12 years of education.
Early Intervention Number of Children Enrolled in Early Intervention as a Percent of Total Children in the City Central Falls: 43 (9%) Newport: 69 (7%) Pawtucket: 227 (8%) Providence: 544 (7%) West Warwick: 80 (7%) Woonsocket: 184 (9%) Rhode Island: 2,977 (8%) • Of the children enrolled in Early Intervention, 29% were younger than age 1, 37% were age 1 and 34% were age 2.
Head Start • In 2005, Head Start served 52% of the estimated 4,848 children ages 3 and 4 in Rhode Island. In the core cities, 41% were enrolled in Head Start whereas 86% of the eligible children in the remainder of the state were served by Head Start.
Children in Full-Day Kindergarten • In Rhode Island in 2005-2006, 47% of children who attended kindergarten were in a full day program. • As of the 2005-2006 school year, 12 school districts offered universal access to full-day kindergarten programs and another 9 school districts operated at least one full-day kindergarten classroom. • The percentage of children participating in full-day kindergarten in the core cities has doubled, from 40% in 1999-2000 to 82% in 2005-2006.
English Language Learners • Of the 8,180 ELL students in 2004-2005, 82% lived in the core cities, with the majority residing in Providence, Central Falls and Pawtucket. Of the 758 (10%) of ELL students in pre-k and kindergarten, 44 (6%) were in Central Falls, 83 (11%) were in Pawtucket , 405 (53%) were in Providence and 40 (5%) were in Woonsocket.
Fourth-Grade Reading Skills • In 2004, 73% of Rhode Island fourth graders scored at or above proficiency in Basic Understanding and 62% scored at or above proficiency in Analysis and Interpretation. All of Rhode Island’s core cities had reading proficiency levels (43%) below the state rates except West Warwick which exceeded the state rate for Basic Understanding by one percentage point. • In Rhode Island between 1998-2005, the percentage of higher income fourth-graders achieving at or above basic understanding was consistently higher than of low-income fourth-graders. In 2005, 41% of low-income fourth-graders scored at or above basic understanding compared to 74% of higher-income fourth-graders.
Math Skills • In 2004, 51% of Rhode Island fourth-graders and 40% of eight-graders scored at or above proficiency. In the core cities, this rate was lower with 33% of fourth graders achieving proficiency and 19% of eighth graders. • While all races experienced decreases in math proficiency between fourth and eighth grade, Hispanic, Black and Asian students experienced a decline almost twice that of White students.
School Attendance • Nearly one out of four (24%) students in the core cities missed over 20 days of school, compared to one out of ten (10%) students in the remainder of Rhode Island and nearly one out of seven (15%) students statewide. • With 15,145 high school students in the core cities, improving the core cities’ attendance rate from 85% to 92% would mean that 1,090 more students would be attending high school in the core cities each day of the school year.
School Suspensions Source: Rhode Island Department of Elementary and Secondary Education, 2004-2005 school year. • Of disciplinary actions assigned to Rhode Island students, 5% were to elementary school students, 38% to middle school students and 57% to high school students. • Of all disciplinary actions during the 2004-2005 school year, 61% were out-of-school suspensions, 37% were in-school suspensions and 2% were alternative program placements.
Children Enrolled in Special Education Source: Rhode Island Department of Elementary and Secondary Education • The percentage of students identified for special education services in Rhode Island has increased substantially over the past twenty years. In the 2003-2004 school year (the most recent year national data were tabulated), Rhode Island had the highest percentage of public school students identified as disabled and receiving special education services under IDEA in the nation.
Children Enrolled in Special Education • In 2004-2005 there were 32,294 students ages 3 to 21 enrolled in special education in Rhode Island elementary and secondary schools. • Students with learning disabilities and speech/language impairments accounted for nearly two-thirds (62%) of special education enrollment in 2004-2005. In 2005, children between the ages of 3 and 8 years old accounted for more than one-quarter of all children enrolled in special education.
Special Education Enrollment Source: Rhode Island Department of Education, data from 2002-2003 school year • For the 2002-2003 school year, Black, Hispanic, Asian and Native American students were underrepresented in special education placement. • In the state fiscal year 2004, Black, Hispanic and Asian students tended to be underrepresented in many disability areas, especially autism and visual impairments. Within the population of students in special education, however, Black, Hispanic and Native American children tended to be disproportionately identified as mentally retarded.
Student Mobility Source: Rhode Island Department of Elementary and Secondary Education, 2004-2005 school year • The core cities have a significantly higher mobility rate (27%) than schools in the remainder of the state (10%). • In 2004 in Rhode Island, 14% of children ages 5 to 19 changed residency at least once during the previous year. The majority of those moved within the same county. Individuals living below the federal poverty threshold were more likely to change residency in Rhode Island in 2004.
High School Graduation Rate 2005 Graduation Rates by Core City Districts Central Falls: 63% Newport: 79% Pawtucket: 71% Providence: 75% West Warwick: 66% Woonsocket: 70% Rhode Island: 85% • In 2005 in Rhode Island, 88% of White students, 81% of Asian/ Pacific Islander students, 79% of Black students, 74% of Hispanic students and 72% of Native American students graduated from high school. • In the core cities, 72% of students graduated from high school, compared to 85% for the state as a whole.
Rhode Island’s Children in Poverty • The percentage of Rhode Island’s children living in poverty increased from 16% in 2000 to 21% in 2004. • According to the American Community Survey, there were 50,390 children living below the poverty threshold in Rhode Island in 2004. • In 2004, 16,326 or 23% of Rhode Island children under age 6 lived below the poverty threshold. • The 2005 federal poverty threshold for a family of three with two children is $15,735 and $19,806 for a family of four with two children.
Child Poverty Rates by Race & Ethnicity Source: U.S. Bureau of the Census, American Community Survey, 2004 • The majority of Rhode Island’s poor children in 2004 are children of color. Rhode Island’s child poverty rates for Hispanic and Asian children are three times the rates for Hispanic and Asian children in the U.S.
Rhode Island’s Children in Extreme Poverty • Of the 50,390 children living below the poverty threshold in 2004, more than half (54%) lived in extreme poverty. • In total, 11% (27,246) of all children in Rhode Island lived in extreme poverty in 2004. • The extreme poverty level in 2005 was family income below $7,868 for a family of three with two children and $9,903 for a family of four with two children.
Cost of Rent • Housing is considered affordable if it consumes 30% or less of a family’s household income. A family of three living at poverty level would have to devote 87% of household income to the cost of rent. • To afford the average rent ($1,147) in Rhode Island without a cost burden, a worker would need to earn $22.06 per hour for forty hours a week, more than three and a half times the state’s minimum wage in 2005 of $6.75 per hour.
Children Enrolled in the Family Independence Program • In December 2005, there were 9,059 adults and 21,891 children under the age of 18 enrolled in the Family Independence Program (FIP), a 46% decline in cash assistance recipients from 1995. Of all children in FIP, 17,134 (78%) lived in the core cities. Source: Rhode Island Department of Human Services, InRhodes Database, December 2005.
Children Receiving Food Stamps • On October 1, 2005 in Rhode Island, a total of 35,168 children under age 18 received food stamps, an estimated 65% of eligible children. • Of 38,649 eligible children in the core cities, 27,168 (70%) were receiving food stamps on October 1, 2005. • Out of the estimated 53,697 children in Rhode Island income-eligible to receive food stamps, 35% are not participating in the food stamp program as of October 1, 2005. Participants as a Percent of Those Income-Eligible by Core City: Central Falls: 2,038 (72%) Newport: 884 (51%) Pawtucket: 3,795 (64%) Providence: 16,767 (75%) West Warwick: 851 (53%) Woonsocket: 2,833 (69%) Rhode Island: 35,168 (65%)
Children Without Health Insurance • As of 2004, there were 16,000 uninsured children under age 19 in Rhode Island. Of these, an estimated 10,000 were eligible for RIte Care. The recent increase in the rate of uninsured children is largely due to the decline in employer-sponsored insurance, with a 10% decline in children covered by employer-sponsored health insurance in the past three years. • Of the 91,144 children receiving Medical Assistance, 59,239 (65%) lived in one of the six core cities.
Births to Teens Births to Teens in Core Cities: Rate per 1,000 Central Falls: 62.9 Newport: 30.2 Pawtucket: 30.4 Providence: 49.5 West Warwick: 19.1 Woonsocket: 44.8 Rhode Island: 20.0 • Over the past decade, teen birth rates for Rhode Island girls ages 15 to 17 declined in all geographic areas. Despite the decreases, teen girls in the core cities give birth at five times the rate of girls of the same age in the remainder of the state. • Between 2000 and 2004 in Rhode Island, one of five teen births (20%) was to a teen who was already a mother.
Overweight Children and Youth • A 2003 study showed 16% of Rhode Island children ages 6-17 were overweight and 15% were at risk for being overweight. • The rate of obesity in Rhode Island high school students increased from 9% in 2001 to 13% in 2005, a statistically significant increase. • Although 13% of Rhode Island high school students were overweight in 2005, 33% considered themselves overweight and many attempted to lose weight by changing their eating and exercise habits.
Alcohol and Drug Use by Teens • Eighteen percent of middle school students and 42% of high school students in Rhode Island reported using alcohol in the previous month. • Almost one in ten (9%) middle school students and more than one in four (28%) high school students in Rhode Island reported using illegal drugs such as marijuana, inhalants, cocaine and methamphetamines.
Homeless Children and Youth • Between July 1, 2004 and June 30, 2005, 1,717 children under age 18 received shelter from Rhode Island’s emergency shelter system, an increase of 15% from the year before. Nearly half, 769 (45%) were age 5 or under and 647 (38%) were ages 6 to 12. • During 2005, 178 youth ages 13 to 17 accessed crisis management services offered by Crossroads RI and 1,286 calls were made to the Crossroads SAFELINE for runaway youth.
Children Witnessing Domestic Violence Number of Incidents with Children Present by City: Central Falls: 73 Newport: 100 Pawtucket: 255 Providence: 469 West Warwick: 74 Woonsocket: 153 • The number of domestic violence incidents reported to Rhode Island police peaked at 8,901 in 2001 and has since declined to 8,143 reported in 2004. • Of the 2,508 domestic violence incidents where children were reported present in 2004, 30% occurred in the six core cities.
Child Abuse and Neglect • In 2005 in Rhode Island, there were 2,260 indicated investigations of child abuse and neglect involving 3,125 children for a rate of 7.5 per 1,000 children. • Fifty-nine percent of indicated investigations of child abuse and neglect in 2005 occurred in the six core cities, even though only 39% of the states’ population under 21 lives in those communities. The rate of 11.1 indicated investigations per 1,000 children in the core cities was over twice as high as the rate of 4.9 for the remainder of the state. Source: Rhode Island Department of Children, Youth and Families
Kat Keenan, MA Policy Analyst Rhode Island KIDS COUNTOne Union Station Providence, RI 02903 kkeenan@rikidscount.org (401) 351-9400 voice (401) 351-1758 fax www.rikidscount.org