Download
1 / 29
290 likes | 366 Views
PingER Project. Arguably the world’s most extensive active end-to-end Internet Performance Project Digital Divide emphasis Partially funded by MoST, US State Department Last three years a joint development effort of SLAC & NIIT

E N D
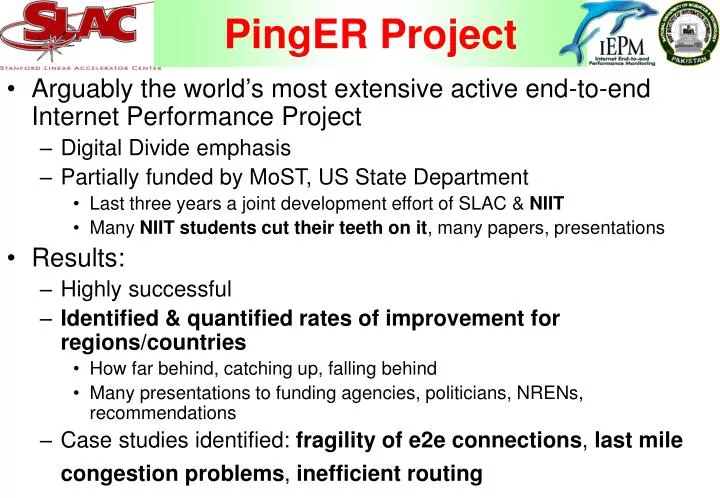
PingER Project • Arguably the world’s most extensive active end-to-end Internet Performance Project • Digital Divide emphasis • Partially funded by MoST, US State Department • Last three years a joint development effort of SLAC & NIIT • Many NIIT students cut their teeth on it, many papers, presentations • Results: • Highly successful • Identified & quantified rates of improvement for regions/countries • How far behind, catching up, falling behind • Many presentations to funding agencies, politicians, NRENs, recommendations • Case studies identified: fragility of e2e connections, last mile congestion problems, inefficient routing
PingER Methodology >ping remhost Uses ubiquitous ping Remote Host (typically a server) Monitoring host Internet 10 ping request packets each 30 mins Once a Day Ping response packets Data Repository @ SLAC Measure Round Trip Time & Loss
Architecture • Monitor hosts send 21 pings each 30 mins to Remote Hosts and cache results • Archive hosts gather data daily, save, analyze & make results available publicly via web
PingER Deployment • PingER project originally (1995) to measure network performance for US, Europe and Japanese HEP community • Extended this century to measure Digital Divide: • Collaboration with ICTP Science Dissemination Unit http://sdu.ictp.it • ICFA/SCIC: http://icfa-scic.web.cern.ch/ICFA-SCIC/ • >120 countries (99% world’s connected population) • >30 monitor sites in 14 countries • Monitor 44 sites in S. Asia
Time Series results • Divides into 2 • India, Maldives, Pakistan, Sri Lanka • Bangladesh, Nepal, Bhutan, Afghanistan • Weekend vs. weekday indicates heavy congestion
Unreachability • All pings of a set fail ≡unreachable • Shows fragility, ~ distance independent • Developed regions US, Canada, Europe, Oceania, E Asia lead • Factor of 10 improvement in 8 years • Africa, S. Asia followed by M East & L. America worst off • Africa NOT improving SE Asia L America M East C Asia Oceania S Asia SE Europe Russia Developing Regions Africa E Asia Developed Regions US & Canada Europe
World thruput seen from US Throughput ~ 1460Bytes / (RTT*sqrt(loss)) (Mathis et al) Behind Europe 6 Yrs: Russia, Latin America 7 Yrs: Mid-East, SE Asia 10 Yrs: South Asia 11 Yrs: Cent. Asia 12 Yrs: Africa South Asia, Central Asia, and Africa are in Danger of Falling Even Farther Behind
Conclusions • Last mile problems, network fragility, poor routing • Decreasing use of satellites, expensive, but still needed for many remote countries in Africa and C. Asia • Africa ~ 10 years behind and falling further behind, leads to “information famine” • Africa big target of opportunity • Growth in # users 2000-2005 200%, Africa 625% • Need more competitive pricing • Fibre competition, government divest for access, low cost VSAT licenses • Consortiums to aggregate & get better pricing ($/BW reduces with BW) • Need better routing - IXPs • Need training & skills for optimal bandwidth management • Internet performance correlates strongly with UNDP & ITU development indices • Increase coverage of monitoring to understand Internet performance
Application to PERN • Place PingER monitoring node(s) inside PERN • V. modest host, trivial install • Add traceroute/landmark server for geolocation • PERN configures to monitor to border routers &/or to end hosts at sites (e.g. site web servers) • Currently gathers data daily, analyze, present via SLAC/FNAL • NIIT/SLAC plans to develop front end to analyze/visualize results on real time basis using cached data & RRD/smokeping
perfSONAR: Next Generation Network Monitoring • Partnership of Internet2 (US), GEANT (EU), ESnet (US), RNP (Brazil) • Plus in the US: SLAC, U Delaware, GATech • 13 EU related NREN deployments of perfSONAR
Why is this hard? • Internet very diverse, hard to find “invariants, phone models do not work • Constantly changing both short and long-term • Changes are not smooth but usually in steps, findings may be out of date • No central organization • Scientific communities span multiple organizations in many countries • Typical path requires crossing at least 5 administrative domains (campus, regional, backbone, regional and campus) • Domains are autonomous • Measurement not high on vendor’s priorities • ISP’s concerned about privacy, competitive advantage, public embarrassment • Diagnosis hard: • Convince ADs there is a problem and that they could/should help • Need multiple pieces of information from multiple sources (ends, multiple middles…), with no coordinating body • Gets even harder for layer 2 networks
New Proposal to Address • Widespread demand for net info by: • Researchers to know how network is performing • Advanced net apps such as Grids (e.g. place data) • Net Ops staffs to diagnose problems • Education • Flexibility in extracting net performance data, needed since • Network changes quickly, diagnostic data is moving target • New tools, metrics and types of analysis are constantly developed • Lack of effective ways to share performance data across domains
perfSONAR Infrastructure Provide/Enable Measurement Points and Archives • Provide Authentication/Authorization • Provide registration, discovery & distributed lookup services • Provide open set of protocols + reference implementation for cross-domain sharing of network measurements • Common performance middleware • Open Grid Forum NMWG = extensible XML data representation • All development is open source to encourage widespread development, deployment, ownership & involvement • Early framework prototypes deployed in Europe, N and S America (Brazil), also adopted by LHC
Next Steps • Develop scalable, distributed, redundant Federated Lookup Service (like DNS) • Integrate common, existing authentication management into perfSONAR • Design and build the Resource Protector to implement policy • Provide specific, useful example diagnostic services as high quality examples (e.g. for traceroute, ping, one-way delay, SNMP, Layer-2 link services etc.) • Provide a Topology service to provide layer-2 & 3 interconnection information • Promote perfSONAR to research community • Students get reliable data from perfSONAR, request on demand measurements, provide new analyses • Turn into hardened/production quality distributable code
Impact NRENs & Customers • R&E relies on reliable networking. • Debugging problems across domains extraordinarily difficult today, increased switched networks will make harder. • PerfSONAR enables divide and conquer between end & intermediate points: • provides easy access to relevant data enables on demand measurements • reduces need to coordinate multi-domain admins (scientist > local net admin > Regional net admin Backbone admin > …), telephone tag, explaining • Reduces participants, hours, days, frustration etc
Benefits Pakistan • Better understanding of customer experience and needs: • utilization, use patterns, event detection, problem diagnosis, planning • Development of better measurement tools, analysis, visualization • Pakistan part of major international community of NRENs, a partnership of users and providers • In Europe, U.S. and S. America • Worldwide R&E people demanding better services • Pakistan research & education access to data to analyze
Benefits Education • NIIT/SLAC proven track record delivering results • 6 students, all will return to Pakistan • 3 at SLAC now • 1 In Silicon valley start-up, 1 in Oxford, 1 returned to NIIT to pursue PhD • Students get exposure to National Lab and world leading researchers • Courses at Stanford • Hands on exposure to production high speed networks such as are planned for Pakistan
One Big Challenge • Elegant graphics are great to understand problems BUT: • Can be thousands of graphs to look at (many site pairs, many devices, many metrics) • Need automated problem recognition AND diagnosis • So developing tools to reliably detect significant, persistent changes in performance • Initially using simple plateau algorithm to detect step changes • Provide reliable alerts • Automatically partially diagnose events • Gather info from routers, monitors etc and eliminate less likely causes
What do we want from you • Now: • Installation and administration of PingER monitoring host (s) inside PERN • Installation & admin of traceroute/landmark servers in major PERN PoP/cities • Chairman HEC asked for proposal to HEC for perfSONAR, will embed PERN requirements in proposal • PERN needs to partner with NIIT/SLAC • Discuss Contributions from PERN • Later: • Deployment of Measurement Points within PERN
More information/Questions • Acknowledgements: • Harvey Newman and ICFA/SCIC for a raison d’etre, ICTP for contacts and education on Africa, Mike Jensen for Africa information, NIIT/Pakistan for developing valuable tools, Maxim Grigoriev (FNAL), Warren Matthews (GATech) for ongoing code development for PingER, USAID MoST/Pakistan for development funding, SLAC for support for ongoing management/operations support of PingER • PingER • www-iepm.slac.stanford.edu/pinger, sdu.ictp.it/pinger/africa.html • Human Development • http://www.gapminder.org/ • Case Studies: • https://confluence.slac.stanford.edu/display/IEPM/Sub-Sahara+Case+Study • http://sdu.ictp.it/lowbandwidth/program/case-studies/index.html
Costs compared to West • Sites in many countries have bandwidth< US residence • “10 Meg is Here”, www.lightreading.com/document.asp?doc_id=104415 • Africa: $5460/Mbps/m • W Africa $8K/Mbps/m • N Africa $520/Mbps/m • Often cross-country cost dominates cf. international 1 yr of Internet access > average annual income of most Africans, Survey by Paul Budde Communnications
UNDP Human Development Index (HDI) • A long and healthy life, as measured by life expectancy at birth • Knowledge, as measured by the adult literacy rate (with two-thirds weight) and the combined primary, secondary and tertiary gross enrolment ratio (with one-third weight) • A decent standard of living, as measured by GDP per capita. Africa PingER - Strong Correlation - Non subjective - Quicker / easier to update
Med. & Africa vs HDI • N. Africa has 10 times poorer performance than Europe • Croatia has 13 times better performance than Albania • Israel has 8 times better performance than rest of M East Med. Countries • E. Africa poor, limited by satellite access • W. Africa big differences, some (Senegal) can afford SAT3 fibre others use satellite • Great diversity between & within regions
Digital Access Index (DAI): Infrastructure availability, Affordability of access, Education, Quality of ICT, & Internet usage Europe, E Asia (except China), Oceania top right Israel & Singapore with top group Middle East in middle, Iran poorest Africa bottom left S. Asia split: Bhutan, Nepal, Bangladesh with Africa India, Pak, Sri Lanka better Strong positive linear correlation, C Asia
Why does it matter: Business Traditional MNC Business Model >$20K per year 75 to 100 million people Some MNCs >$1,500 - 20K per year 1.5 to 1.75 billion people Local Firms Future Opportunity? <$1,500 per year 4 billion people • G8 specifically pledged support for African higher education and research by “Helping develop skilled professionals for Africa's private and public sectors, through supporting networks of excellence between African's and other countries' institutions of higher education and centres of excellence in science and technology institutions” G8 specifically pledged support for African higher education and research by “Helping develop skilled professionals for Africa's private and public sectors, through supporting networks of excellence between African's and other countries' institutions of higher education and centres of excellence in science and technology institutions” Prahalad and Hart • Saturating western markets • High growth IT markets: BRIC • NOT business as usual • New business models • Distinct needs • Dearth of distribution channels Karen Coppock RDVP, Stanford
Experimental Alerting • Have false positives down to reasonable level (few per week), so sending alerts to developers • Saved in database • Links to traceroutes, event analysis, time-series
Normalized for Details • Note step changes • Africa v. poor • S. Asia improving • N. America, Europe, E Asia, Oceania lead