Download
1 / 18
180 likes | 326 Views
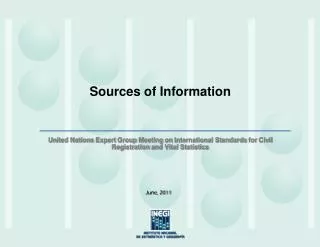
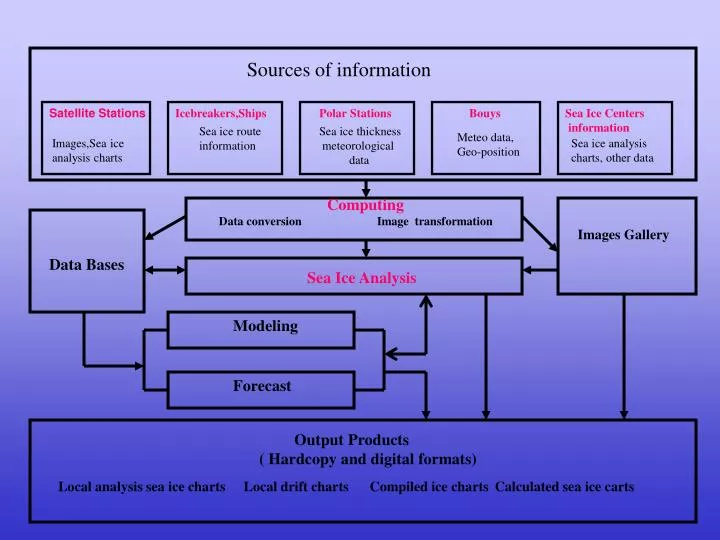
Sources of information. Satellite Stations. Icebreakers,Ships. Polar Stations. Bouys. Sea Ice Centers information. Sea ice route information. Sea ice thickness meteorological data. Meteo data, Geo-position. Images,Sea ice analysis charts. Sea ice analysis

E N D
Sources of information Satellite Stations Icebreakers,Ships Polar Stations Bouys Sea Ice Centers information Sea ice route information Sea ice thickness meteorological data Meteo data, Geo-position Images,Sea ice analysis charts Sea ice analysis charts, other data Computing Data conversionImage transformation Data Bases Images Gallery Sea Ice Analysis Modeling Forecast Output Products ( Hardcopy and digital formats) Local analysis sea ice chartsLocal drift chartsCompiled ice chartsCalculated sea ice carts
Floating Ice Fast Ice MeaningR G B Nilas FY thin ice Open Water 1 128 255 New Ice 1 213 255 Dark Nilas 25 1 255 Rind FY medium ice Light nilas 6 248 242 Young ice 243 81 255 Grey ice 247 197 251 Young ice FY thick ice Grey-white ice 168 42 238 FY thin ice 155 210 0 FY thin ice (30 -50 cm) 213 251 127 Grey ice Old ice FY thin ice (50-70 cm) 175 251 5 FY medium ice 18 192 26 FY thick ice 9 97 13 Grey-white ice Second-year ice Old ice 134 45 0 Second-year ice 255 125 7 Multi-year ice 0 0 0 First-year ice Multy-year ice Undefined ice 178 178 178 The Color Scheme for Russian sea ice charts(Winter)
Floating Ice Fast Ice MeaningR G B Nilas FY thin ice Open Water 1 128 255 < 10% 6 248 242 10- 30% 213 251 127 Rind FY medium ice 40 - 60% 9 97 13 70 - 80% 255 125 7 90% 188 100 34 Young ice FY thick ice 90-100% 134 45 0 100 82 27 0 Grey ice Old ice Grey-white ice Second-year ice First-year ice Multy-year ice The Color Scheme for Russian sea ice charts(Summer)
An Example of NIC historical sea ice chart on fifth week of 1994 ( AARI's color scheme is used)
Data loss after re-projection! Polar Stereographic projection WGS84, Central meridian-180 True scale latitude - 60 Polar Stereographic projection Sphere,Central meridian - 110E True scale latitude - 90
An example of re-projected NIC analysis sea ice chart (polar stereographic projection Central meridian - 110 E True scale latitude - 90,Spheroid - Sphere )
The sea ice interpretation peculiarity The fragment of NIC analysis sea ice chart on 1999.11.22 The fragment of AARI analysis sea ice chart on 1999.11.19
Why Raster to Vector conversion?. Output data format for sea ice modeles Header 1. Data type (1 – concentration + thickness, 2 - hummocking , 3 – degree of destruction , 4 – compacting, reserve up to 10 ) Integer (2 bytes) 2. Amount of rows - Integer (2 bytes) 3. Amount of columns – Integer (2 bytes) 4. Coordinates of center of the left top cell in projection coordinates, which was used to develop a grid x (real f8.2 - 4 bytes) y (real f8.2 - 4 bytes) 5. Central meridian L = 110.0 (real f5.2 - 4 bytes) 6. Size of cell (real f5.2 - 4 bytes) 7. Date, on which the calculation was performed (Char 10) The total length of the headline is equal to 32 bytes. Body Continuous data array with type Integer(2 bytes) Total file volume = Amount of rows * Amount of columns * Integer + Total length of headline Grid as Vector (Forecast data)
How can we support the navigation by sea ice information? • Hardcopy ? • Telexes ? • Digital formats ? It is very important to integrate sea ice information into ship chart display systems. How can we do it? - To co-ordinate additional sea ice codes for S57. - To create the utilities for ship chart display system.
What data formats should be chosen for data share?What map projections should be used?Who can able to help us to solve all these tasks?