Download
1 / 1

E N D
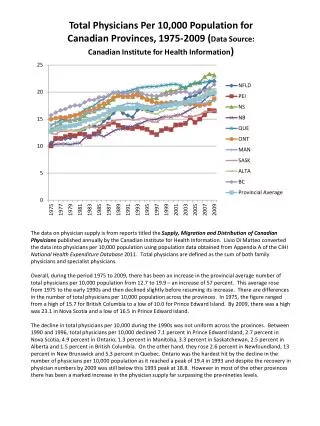
The data on physician supply is from reports titled the Supply, Migration and Distribution of Canadian Physicians published annually by the Canadian Institute for Health Information. Livio Di Matteo converted the data into physicians per 10,000 population using population data obtained from Appendix A of the CIHI National Health Expenditure Database 2011. Total physicians are defined as the sum of both family physicians and specialist physicians. Overall, during the period 1975 to 2009, there has been an increase in the provincial average number of total physicians per 10,000 population from 12.7 to 19.9 – an increase of 57 percent. This average rose from 1975 to the early 1990s and then declined slightly before resuming its increase. There are differences in the number of total physicians per 10,000 population across the provinces. In 1975, the figure ranged from a high of 15.7 for British Columbia to a low of 10.0 for Prince Edward Island. By 2009, there was a high was 23.1 in Nova Scotia and a low of 16.5 in Prince Edward Island. The decline in total physicians per 10,000 during the 1990s was not uniform across the provinces. Between 1990 and 1996, total physicians per 10,000 declined 7.1 percent in Prince Edward Island, 2.7 percent in Nova Scotia, 4.9 percent in Ontario, 1.3 percent in Manitoba, 3.3 percent in Saskatchewan, 2.5 percent in Alberta and 1.5 percent in British Columbia. On the other hand, they rose 2.6 percent in Newfoundland, 13 percent in New Brunswick and 5.3 percent in Quebec. Ontario was the hardest hit by the decline in the number of physicians per 10,000 population as it reached a peak of 19.4 in 1993 and despite the recovery in physician numbers by 2009 was still below this 1993 peak at 18.8. However in most of the other provinces there has been a marked increase in the physician supply far surpassing the pre-nineties levels.