Download
1 / 11
180 likes | 589 Views
Gene Set Enrichment Analysis (GSEA). Gene Set Enrichment. Example: human diabetes. Skeletal muscle biopsies. No single gene was found to be significantly regulated

E N D
Gene Set Enrichment Example: human diabetes Skeletal muscle biopsies • No single gene was found to be significantly regulated • GSEA was used to assess enrichment of 149 gene sets including 113 pathways from internal curation and GenMAPP, and 36 tightly co-expressed clusters from a compendium of mouse gene expression data. Normal Diabetic These GSEA results appeared in Mootha et al. Nature Genetics 15 June 2003, vol. 34 no. 3 pp 267 – 273: PGC-1α-responsive genes involved in oxidative phosphorylation are coordinately downregulated in human diabetes
Max. Enrichment Score ES Enrichment Score S Gene Set G Phenotype Gene List Order Index Ordered Marker List hit (member of G) miss (non-member of G) Enrichment: KS-score • Rank genes according to their “correlation” with the class of interest. • Test if a gene set (e.g., a GO category, a pathway, a different class signature) is enriched. • Use Kolmogorov-Smirnoff score to measure enrichment. Subramanian et al., PNAS 2005 Mootha et al., Nature Genetics 2004
Enrichment: KS-score Enriched Gene Set Un-enriched Gene Set Max. Enrichment Score ES Max. Enrichment Score ES Enrichment Score S Enrichment Score S Gene List Order Index Gene List Order Index Every hit go up by 1/NH Every miss go down by 1/NM The maximum height provides the enrichment score
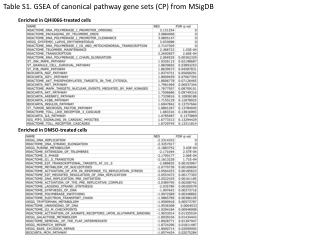
GSEA Example: p53 Datasets: http://www.broadinstitute.org/gsea/datasets.jsp Gene sets: http://www.broadinstitute.org/gsea/msigdb/collections.jsp Analysis results: http://www.broadinstitute.org/gsea/resources/gsea_pnas_results/p53_C2.Gsea/index.html Histogram of # gene sets vs. enrichment score The Broad Institute of MIT and Harvard
Options for running GSEA • Use the GenePattern module • Use the stand-alone desktop application • (see www.broadinstitute.org/gsea/downloads) • Use the R implementation • (see www.broadinstitute.org/gsea/downloads)
GSEA input files • Gene expression dataset • [or alternatively, a ranked list of genes] • Phenotype labels • Discrete phenotypes – two or more • Continuous phenotypes, e.g. time series • Gene sets • Select an MSigDB gene set collection • Or supply a gene set file • Chip annotations • Used to (optionally) collapse expression values into one value per gene • Used to annotate genes in the analysis report
Leading edge analysis • Leading edge subset of a gene set = the genes that appear in the ranked list before the running sum reaches the max value. • Leading edge analysis = examine the genes that are in the leading edge subsets of the enriched gene sets.
Molecular Signatures Database The Molecular Signatures Database (MSigDB) gene sets are divided into 5 major collections: c1: positional gene sets for each human chromosome and each cytogenetic band c2: curated gene sets from online pathway databases, publications in PubMed, and domain expert knowledge c3: motif gene sets based on conserved cis-regulatory motifs from a comparative analysis of the human, mouse, rat, and doc genomes. c4: computational gene sets defined by expression neighborhoods centered on 380 cancer-associated genes c5: GO gene sets consist of genes annotated by the same Gene Ontology terms.
Molecular Signatures Database • Current release of MSigDB: • Version 3.0 released September 2010 • Contains ~6800 gene sets
MSigDB web site • http://www.broadinstitute.org/msigdb • Search for gene sets in MSigDB • View gene set details • Download gene sets • Compute overlaps between your gene set and gene sets in MSigDB