Download
1 / 45
450 likes | 533 Views
Energy Policy in Kansas. Sierra Club Perspective. Kansas is in the Cross Hairs of Global Warming. Increase in average temperature (deg C), summer of 2080-2099 compared to 1980-1999. Source: IPCC, 2007. Renewable Energy - Kansas Has a World Class Wind Resource.

E N D
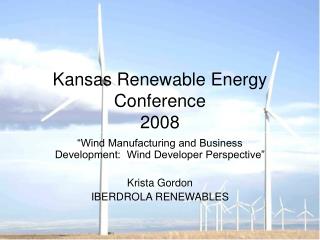
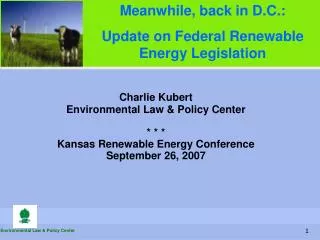
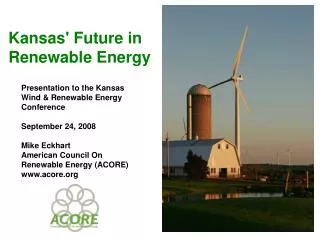
Energy Policy in Kansas Sierra Club Perspective
Increase in average temperature (deg C), summer of 2080-2099 compared to 1980-1999. Source: IPCC, 2007
Capacity Factors for Wind Farms in Kansas • Combination of geographic area, localized terrain features, turbine advances • 80 meter hub height in Kansas • Capacity factors: Class 5 winds = 37%; Class 6 winds = 39% and Class 7 winds = 42% (source: B&V, AWEA) • Typical good Kansas Site is Class 6 with 40% capacity factor • TradeWind Energy, Inc says their new site west of Salina is 45%+
Costs of electricity from new sources - $/MWh basis • New supercritical pulverized coal plant: $70 • Combined Cycle Natural Gas: $74 • Wind Farm in Kansas: without PTC: $67, • Wind Farm in Kansas: net of PTC: $44 incl. grid cost • Energy Efficiency: $40 • Sources: Union of Concerned Scientists (from AWEA) and KCC proceedings, Fall, 2007
Burning Coal Is Not Cheap Anymore • Especially if the likely cost of carbon regulation is plugged in • Wisconsin Public Utility Commission Now Assumes Additional $22/MWh cost for Coal Plants
and Source cheaper than coal and gas, with CO2 prices Pulverized Coal Conc. Solar (2015) Natural Gas CC Geothermal Wind Class 4 Conc. Solar (2030) Wind Class 6 Efficiency
Other important cost/risk factors • Capacity increment and construction interval • Fuel source, fuel cost inflation • Grid integration & Transmission • Fuel cost displacement by wind power • Reliability standard • Other environmental cost externalities (health costs from ozone smog and fine PM)
Net Capacity increment and construction interval (after permit issued) • Coal: 500 - 750 MW, 4 years + • NG Combined Cycle: 250 - 300 MW, 2 &1/2 years • Wind farm: 40 - 60 MW, 1 - 1&1/2 years • Energy efficiency: ongoing and incremental
Fuel source, fuel cost inflation • Coal: shipped in from Wyoming with diesel fuel & w/ additional carbon emissions; medium fuel cost with high risk of inflation; • Natural Gas: N. American supply, local source in decline; high fuel cost, • Wind farms: no fuel cost, ever; • Energy efficiency: no fuel cost other than by administrative personnel
Grid Integration - Wind Farms • Back up by purchased power (usually remote natural gas generator) or in-house NG combustion turbine • Industry studies: add $3 - 5/MWh • SPP started new Energy Imbalance Service Market in Feb. 07
Grid integration - Base Load Power Plants • Base load plants are also heavily dependent on grid back-up. Large MW dropping off-line can stress grid • Coal plants are prone to frequent unplanned shut downs especially tube leaks & control problems, • Also major breakdowns & accidents related to coal handling, process component failures, transformer fires, transmission lines. • Ex. Westar, Dec.07, KCPL Hawthorne #5: tube fail ‘98: 78 days, boiler explosion ‘99: 28 mo., transformer ‘05: 32 days
Reliability standard • Utilities must have reserve capacity, ex. 12% safety factor over peak load • Only about 10% of rated capacity and 25% of average output of wind is accredited capacity • Utilities thus view an MW of wind power as less valuable than MW from other generators such as NG combustion turbines or from coal and nuclear plants; • But the 12% safety factor is calculated on a scenario where large coal or nuclear plants fail; • When the wind stops blowing 50 MW wind farm goes down. • When the entire Jeffrey Energy Center shuts, 2200 MW goes off line. • Misallocation of cost/risk.
Fuel cost displacement by wind power • How about the cost of backing up wind power? • Where’s the natural gas going to come from since the SW Ks gas fields in decline?
Kansas Wind Patterns • Winds Blow Best During the Day • From confidential wind site in western Kansas • Annual average hourly variation • Left vertical axis is at midnight
Fuel cost displacement by wind power - continued • Wind power displaces more natural gas than it uses for back up • Empire District Power Co: “The amount and percentage of electricity generated by natural gas decreased significantly in 2006 compared to 2005 due to energy we purchased from the Elk River Wind Farm, LLC in 2006 (2006 Annual Report)
AWEA National Study • 20% penetration of wind power in US would: • Reduces NG use by 11% • Reduces price by 12%, $0.90 per mmbtu • Source: AWEA presentation to Ks Transmission Summit V, Dec. 2007
Analysis of Western Kansas Wind Power Characteristics during 2003 Kansas City Heat Waves Craig Volland, QEP Spectrum Technologists
Typical Hot Summer Day Load Curve Peak Load Intermediate Load L o a d Base Load 1 am 12 pm Hour of Day
Daily Load Intervals • 11 am to 11 pm: intermediate load • 2 pm to 6 pm: peak load • That’s when power is needed the most to displace expensive NG - fired combined cycle and combustion turbines
Fuel cost displacement by wind power - continued • Actual cost effect is a function of a utility’s generator fleet fuel profile and peak load growth • Example case: KCP&L. Values of Fuels displaced by wind farm ($/MWh): Purchased Power: $87.57, Natural gas: $80.60, Coal: $13.72 & Nuclear: $4.24 (Source KCPL testimony, 2006) • Key is to flat-line load growth with energy savings, then there is no need for additional fossil fuel generation as wind displaces existing plants over time.
Energy Efficiency and Conservation • A Key to phasing out fossil fuel generators over time • EE&C requires no imported fuels and few imported components & parts. • Mainly ingenuity and commitment by utilities and public • Policy changes
Energy Efficiency and Conservation - continued • Utilities need profit incentive • Intense public education • Large Investment in public monies to help low income people save energy • Not welfare; it’s a public investment that will directly benefit everybody and compensate, at least in substantial part, for higher energy costs overall
Constraints to Wind Power in Kansas • Level playing field for wind power: • Either extend the PTC, establish a national RPS or Congress needs to firmly regulate carbon dioxide emissions • Siting issues: some environmental and aesthetic trade offs will be necessary
Wind Farm Restrictions in Kansas • This is a review of spatial restrictions on the placement of wind farms in Kansas proposed by some advocacy groups • Source: Encouraging Development of Wind Energy Resources: A White Paper Prepared for the Kansas Energy Council by Joe King, Coriolis, Aug. 23, 2006
Map by map, we will begin to black out those regions that are being proposed as off-limits for wind power, beginning with National Preserves and Significant Wetlands.
National Preserves, Wetlands, Scenic Byways, Arch. & T&E, Scenic, Untilled Lnd
* Kansas wind map is a general indication. Exceptional sites can exist due to terrain features.
Wind Classes and Uses • Class 2 Winds are uneconomic. • Class 3 Winds are very marginal. • Class 4 Winds are suitable for Community Wind with special incentives. • Class 5 & Class 6 Winds are sought by utility scale developers.
National Preserves, Wetlands, Scenic Byways, Arch. & T&E, Scenic, Untilled Lnd, Class 2 Wind, Class 3 Wind.
National Preserves, Wetlands, Scenic Byways, Arch. & T&E, Scenic, Untilled Lnd, Class 2 Wind, Class 3 Wind, Class 4 Wind.
Impact of these restrictions on Wind Industry in Kansas • For all practical purposes, utility scale wind farms can be installed only in far west Kansas where transmission lines are currently inadequate • Prevents dispersion of wind farms to smooth output and increase reliability • Would severely limit the growth of the wind Industry in Kansas • Likely to ensure a continued coal based energy system
Wind Farm Siting Policy • We are running out of time to fight global warming • Some tradeoffs may be necessary • Common Sense needed • Detailed Sierra Club Wind Siting Position at www.kansas.sierraclub.org
Long term solutions • Distributed generation using primarily PC solar panels; Costs declining rapidly; • PV solar panels as energy source and energy savings • Community scale wind farms • Net metering may not be necessary in short run • Utilities say net metering must take into account cost of back-up transmission system • Long term solution needed that is fair to everyone