Download
1 / 22
220 likes | 327 Views
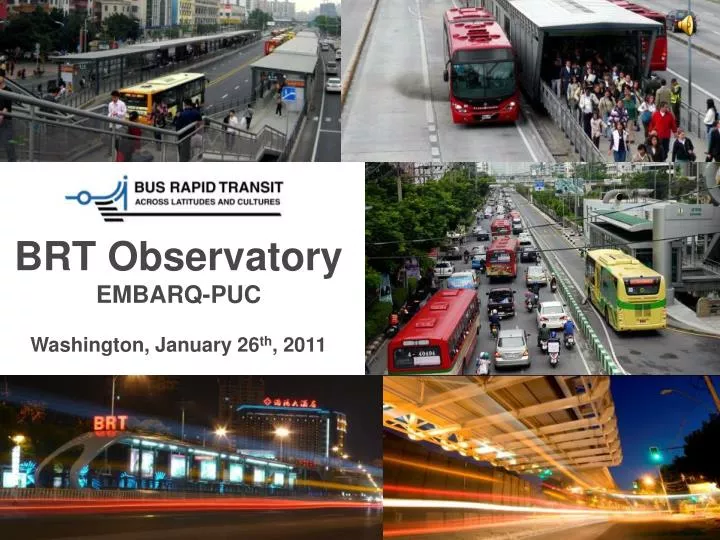
BRT Observatory EMBARQ-PUC Washington, January 26 th , 2011. Objectives. Create the world’s most complete reference to the state of the practice in BRT Provide information for benchmark analysis between corridors and/or systems Provide some type of BRT accreditation (BRT Scale)

E N D
Objectives • Create the world’s most complete reference to the state of the practice in BRT • Provide information for benchmark analysis between corridors and/or systems • Provide some type of BRT accreditation (BRT Scale) • Create liaisons with transit agencies • Provide questions for our research agenda and data for our projects • Develop few case studies • Build a bridge between research and practice
Description • We are gathering information at three levels: • Shallow (~119 cities, ~279 corridors) - Atlas • Medium (~50-60 cities, 100+ corridors) - For Econometric Models • Deep (~ 15 cities systems, 25+ corridors) – Detailed Case Studies, transversal (common to the cities), horizontal (very complete description and analysis of a city/system)
Information Scopes Deep, very detailed information for complete case studies, very strong contacts, time and visits (~ 15 cities systems, 25+ corridors) Medium, enough corridors for econometric analyses, strong contacts and time effort (~50-60 cities, 75+ corridors) Level of Information Shallow, the most systems Desktop and light contacts (119+ cities, 279+ corridors) Number of Cities, Systems, Corridors
Current status • We have defined a list of variables to study and created an instrument to collect the data – interaction of PUC-ITLS-EMBARQ • We applied the pilot instrument to four cities (corridors) • Juan Carlos Muñoz and Daniela Facchini presented at the VREF meeting in Nairobi, Kenya (Dec 2010) – 7 CoE indicated willingness to collaborate with data collection • We produced a report on the pilot data collection effort • We created a basic list with 119 cities with BRT systems and bus corridors in operation and a presentation on the status of the BRT industry worldwide • We are improving the instruments and databases and collecting data (shallow and medium level-partial) • Preliminary results expected for Aug-Sep 2011
Our updated list of cities with BRT and bus corridors in operation includes 119 cities, 278 corridors, 4287 km, 6569 stations, 30K buses and 26.8 million passengers per weekday
Summary information from the current dataset Source: BRT and Bus Corridors Dataset, Summary by Region and Country, EMBARQ, January 12, 2011
Latin America and Asia have similar BRT/Bus Corridor km, but LAC dominates in ridership Source: BRT and Bus Corridors Dataset, Summary by Region and Country, EMBARQ, January 12, 2011
Observatory data collection effort 2011 • Basic • 119 Cities, 279 corridors • Expand the indicators to 20-25 • Expand cities to ~140, corridors ~300 (new projects and missed cities) • Data verification and update • Medium • Select 50-60 cities ~100 corridors for medium level (for econometric analyses) • EMBARQ: around 15-20 cities, 30-40 corridors for medium level • Others 30-40 cities to be defined • Deep • Select cities for very comprehensive data collection • EMBARQ 7-8 cities, update and improve case studies
In depthcitiesselection (proposed) Others with good background information and contacts (SIBRT): Guadalajara, México México City Quito, Ecuador Lima, Perú Cali, Colombia Bucaramanga, Colombia Barranquilla, Colombia • Santiago, Chile - PUC • Bogotá, Colombia - EMBARQ • León, México - EMBARQ • Pereira, Colombia - EMBARQ • Guayaquil, Ecuador - EMBARQ • Istanbul, Turkey - EMBARQ • Ahmedabad, India - EMBARQ • Guanghozou, China • Johannesburg, South Africa • Sydney, Australia - • Brisbane, Australia • Los Angeles, USA • Boston, USA 14-15 (Europe?)
Types of Indicators • Socio demographic city context • Project planning and implementation • Intermodal integration and transfers • Physical characteristics of the corridor • Bus services • Bus stops and stations • Information to users • Buses • Fare and fare collection system • Bus operations • Passengers use of the system20 • Contracts and operators ownership • Safety and security • Operational costs • Marketing Identity • Urban Impacts 381 deep indicators 121 medium indicators ~ 20-25 shallow indicators
InformationSources • General References: TCRP “Report 90 Bus Rapid Transit”, ITDP-GTZ’s “BRT Planning Guide”, and US-FTA “BRT Characteristics for Decision Makers”. • Web references as: http://www.chinabrt.org/defaulten.aspx; http://www.nbrti.org/contact.html; http://www.gobrt.org/ • Internal references EMBARQ (Case studies Curitiba, Quito, Bogotá, León, México, São Paulo, Pereira, Guayaquil, Santiago, Beijing, Jakarta, Delhi, Ahmedabad, Istanbul) • Internalreferences PUC (Santiago, Quito) • Other BRT CoE members: Australia, Portugal, USA • Other VREF CoE: China, South Africa, United Kingdom, Australia, USA and India • Latin American Association of BRT and Integrated Bus Systems - SIBRT: founding members Curitiba, São Paulo, Belo Horizonte, Goiania, Santiago, Bogotá, Pereira, Cali, Barranquilla, Bucaramanga, Quito, Guayaquil, México, Guadalajara
Medium Level Indicators Observatory Pilot Questionnaire • Capture and record the experience of elaborating and filling out the questionnaire • Collaborative effort EMBARQ-ITLS-PUC
Data collection November-December 2010 • Linha Verde BRT Corridor – Curitiba, Brazil (CTS-Brasil) • 156/180 questions answered for 1 corridor • total of 169 person-hours dedicated to data collection • Optibús BRT System – León, México (CTS-México) • 121/180 questions answered for 5 corridors • total of 64 person-hours dedicated to data collection • Trolebús BRT Corridor – Quito, Ecuador (PUC-Chile) • 151/180 questions answered for 1 corridor • Pajaritos Sur BRT Corridor – Santiago de Chile (PUC-Chile) • 116/180 questions answered for 1 corridor
Results - Information Availability Linha Verde BRT Corridor – Curitiba, Brazil Optibús BRT System – León, Mexico Pajaritos Sur BRT Corridor – Santiago de Chile, Chile
Results Information Availability Information not available for the four pilot corridors
Mainfindings • It was not possible to fill the pilot questionnaire from internet sources – needs internal contacts and time • Some questions need clarification • 33% of the indicators were very hard to get or not possible at all • Data did not have references, or references were wrong • Some information is not divided per corridor; it belongs to the whole system of corridors within the city • We verified the need for improvements on the spreadsheet to better organize the data and make analyses easier
Somedefinitions and actionsrequired • Clarity of some questions (e.g. 14, 53, 57, 58) • What to do with indicators we were not able to get • How to get indicators that were very hard to get, which are important for econometric analyses • Making sure sources are well registered • Which indicators to be sourced centrally (e.g. PPP) • How to divide general information of the system by corridors (divide per km? per vehicle? per passenger?) • Feedback and suggestions for improvement for the excel spreadsheet.
Observatory schedule • Basic Databases Shallow and Medium • Agree on basic indicators: EMBARQ, PUC, September 2010 OK • Pilot questionnaire: EMBARQ, PUC, December 2010 OK • Basic dataset 119 cities, 279 corridors: EMBARQ, January 2011OK • Complement basic dataset (~140 cities, 300 corridors, 20-25 indicators, validate data) January-May 2011 • Define medium level dataset (50-60 cities, ~100 corridors) and mechanism to get to medium level indicators (EMBARQ 15-20 cities, 30-40 corridors) January –July 2011 • Prepare a report to be web published – EMBARQ, PUC July-August 2011 • Review first annual report – CoE members – Sep-Oct 2011 • Web Publish first annual report – EMBARQ, PUC November 2011 • Repeat process 2011-2012
In depth – case studies • Agree on cities and distribution of responsibilities: CoE, January-February 2011 • Agree on data collection methodology, in depth structured survey: EMBARQ-PUC, coordination with SIBRT, March-April 2011 • Site visits and data collection, EMBARQ, PUC, others as required and possible, May-Sep 2011 • Data consolidation and analysis, EMBARQ-PUC, Oct-Nov 2011 • Prepare small publication combining extended database and deep dive, Dec 2011 • Prepare a long publication combining basic database and deep dive, Dec 2011 – Feb 2012 • Review long publication, CoE and other experts, March – April 2012 • Publish book: BRT State of the Practice Worldwide June 2012
Case Studies - Future • BRT and Road Safety (ongoing, responsibility of EMBARQ, fundedbyBloombergPhilanthropies). WewillrequestreviewbyCoEmembers. • Other case studiestobedefined, ideas: • Studiesfundedby SIBRT? (issue of confidentiality) • Fareevasion in bus systems • Bus advancedtechnologies: costs, barriers, opportunities, impacts – Hybrid buses study (opportunitywith Clinton Foundation –IDB)