Download
1 / 21
210 likes | 324 Views
LAB REPORT. DR. AYAX PEREZ. STEPS. TOPIC APPROACH USE AIM THEORY HYPOTHESIS VARIABLES. STEPS. 8 . MATERIAL AND METHODS 9. DATA COLLECTION 10. DATA PROCESSING 11. ANALYSIS 12. CONCLUSION 13. ERROR ANALYSIS. TOPIC. MAIN IDEA SPECIFIC NAME

E N D
LAB REPORT DR. AYAX PEREZ
STEPS • TOPIC • APPROACH • USE • AIM • THEORY • HYPOTHESIS • VARIABLES
STEPS 8. MATERIAL AND METHODS 9. DATA COLLECTION 10. DATA PROCESSING 11. ANALYSIS 12. CONCLUSION 13. ERROR ANALYSIS
TOPIC • MAIN IDEA • SPECIFIC NAME • Something you are studying this year.
APPROACH • What area of your topic are you going to study? • How will you study your problem?
USE • PRACTICAL USE • REAL LIFE USE • How can your project help other people? • In what real life situation can your project be used?
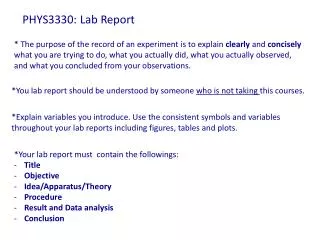
AIM • Objective, Goal, Problem • First • Clear: whoever reads it, should understand what you want to do. • Concise (short) • Practical use!!! • Question form • If the teacher states the aim you shouldn’t just copy that down, you need to make it yours, in your own words, to get a full score.
THEORY • A general background that will back-up your hypothesis. • It must be related to your aim. • Should be short, but with enough information to produce a hypothesis. • It´s important to have several different sources in order to be reliable.
HYPOTHESIS • Educated guess • Cause and prediction of the investigation. • Needs to be very clear • Give an exact and complete description of what you think might happen (and why). • If … INDEPENDENT V... then… DEPENDENT V ... Because ... SCIENTIFIC EXPLANATION.
VARIABLES • INDEPENDENT VARIABLE • DEPENDENT VARIABLE • CONTROLED VARIABLES
INDEPENDENT VARIABLE • Is the one that you alter throughout your experiment. • You must have at least 7 variations of it. • You decide how to change the variable. • It must be chosen according to what you want to prove. • The variations will allow you to have different results and from them you can come to a real conclusion.
DEPENDENT VARIABLE • Is the variable that you measure. • It is the effect of the variable you modified. • You must explain how you will measure it. • It corresponds to `y` in the table and graph. • Explain how changes of the dependent variable were monitored. How you got your results.
CONTROLLED VARIABLES • The variables that you try to keep constant throughout your experiment so that they don’t affect your experiment. • You must explain how they will be controled during the experiment.
Materials and methods • List of all the equipment. • Size of beakers/measuring cylinders, etc, used. • State the error of measurement of the instrument. • Names of any chemicals or materials that are going to be used in the experiment. • Diagram (picture) experimental set up if necessary.
Materials and methods • Describe the method. It should be written in past tense (not written as a guide on how to carry out the experiment again, but rather, how you did it). • The steps in the experiment are either self-evident or explained.
Materials and methods • Write how you made sure that the sufficient relevant data was recorded. • Describe the method for data collection, i.e. if you had several trials, if you used controls, methods of measurements, if your calculations are correct, etc.
Data collection • Record all your raw data in tables. • The tables should be numbered and have captions in which you briefly describe the contents of the tables and how you recorded the results. • Titles, units and the uncertainty should be given in the headings of the tables. • Underneath the table you can briefly describe the results. You can describe the main trends and account for any anomalous result. • You don’t have to discuss the significance of the results to the aim of the investigation.
Data Processing and presentation • The data should be processed (calculated) correctly. • Presented in tables and graphs. • If you use graphs, they should have a caption in which you describe the contents of the graph. • The axes of the graphs have to be labeled with units and the points have to be plotted correctly. • Make sure that you use the correct type of graphs. If both variables are continuous, use a point graph. • Error analysis should be carried out if possible (calculate the percentage uncertainty, etc).
Analysis • Discuss the results you obtained in relation with your hypothesis. • Write an analysis based on an interpretation of the gathered results. • Compare your results with literature values if possible. • Remember you must relate your findings with your theory, hypothesis and aim!
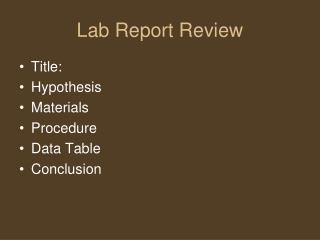
Conclusion • State if your hypothesis is right or wrong in two sentences. • Remember your explanations were done in Analysis.
Evaluation • Evaluate the method used. • Write about the main weakness of the method used and the weakness in the method of manipulation of data. • Write about the source of error, but don’t include personal mistakes. • Suggest real improvements (that can be carried out in the school lab) to the investigation. • Discuss further investigations that are of interest and can be carried out and new questions that could be posed.