Download
1 / 12
120 likes | 198 Views
Variability and Forcing of Fluxes through Nares Strait and Jones Sound: A Freshwater Emphasis. Kelly Falkner, Roger Samelson, Marta Torres, Oregon State University (OSU) Andreas Münchow, Kuo Wong, University of Delaware (UDel)

E N D
Variability and Forcing of Fluxes through Nares Strait and Jones Sound:A Freshwater Emphasis • Kelly Falkner, Roger Samelson, Marta Torres, Oregon State University (OSU) • Andreas Münchow, Kuo Wong, University of Delaware (UDel) • Humfrey Melling, Fiona McLaughlin, Robie Macdonald, Eddy Carmack, Institute of Ocean Sciences (IOS), Canada • Tom Agnew, Atmosphere & Environment, Canada • Peter Jones, John N. Smith, Bedford Institute of Oceanography (BIO), Canada
10% of world’s river water 25% of world’s shelves 3.9% ocean area 1.2% ocean volume
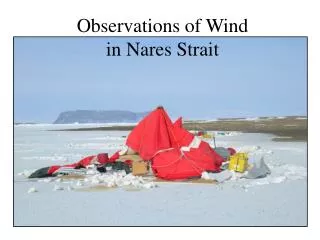
Challenges: • Magnetic North Pole nearby • Ice bridges and ice bergs • Strong tidal currents (~ 1 m/s) • Small internal Rossby radii (ocean and atmosphere) • Ageostrophic winds (hydraulics, katabatics) • Ice and water contribute to freshwater flux • Canadian & Greenland native • community concerns June 3, 1998 AVHRR
Objectives: • Quantify flows • Quantify tracer distributions • Develop proxy records • Diagnose dynamics • Suggest monitoring array • Conduct outreach & training • Freshwater fluxes from tidal to interannual time scales: • Barotropic vs. baroclinic contribution to flux? • Local vs. remotely forced flux? • Tidally rectified contribution to mean flux?
Methods • Moorings (velocity, pressure, salinity, ice draft, tracers) • Surveys (tracers, hydrography, velocity) • Remote Sensing (AMSR*, AVHRR) • Paleo-environmental proxies (bivalves, cores) • Modeling (sub-mesoscale winds) • Teachers, students and native participants “on board” water samplers ~40 year’s worth of “tree rings” *EOS Aqua Satellite Advanced Microwave Scanning Radiometer-E 89 GHz, daily coverage, 4x6 km spatial resolution
Humfrey Melling’s Mooring Program
Project Time Table • Jan. 1, 2003: • summer 2003: • spring 2005: • summer 2006: • spring 2007: • Dec. 31, 2007: NSF funding starts Mooring deployment from USCGC Healy Mooring recovery and re-deployment through ice Survey from CCGS Louis St. Laurent (?) Mooring recovery through ice (3.5 yr record) NSF funding stops
Main Section: +500-m ~3Ld 0-m • Ld is the internal Rossby radius of deformation Ellesmere Greenland -500-m • Measure flux with moored 75 kHz ADCPs and CT/CTD strings that resolve Ld
Gaps from our perspective • Lack of in-channel meteorological observations • Jones Sound program terminating 2004 • Lancaster Sound program insufficient • Ice-ocean-atm dynamical modeling