Download
1 / 17
170 likes | 263 Views
4.4. Graph Exponential Growth Functions. Vocabulary. An exponential function has the form y = ab x , where a ≠ 0 and the base b is a positive number other than 1. If a > 0 and b > 1, the function y = ab x is an exponential growth function

E N D
4.4 Graph Exponential Growth Functions
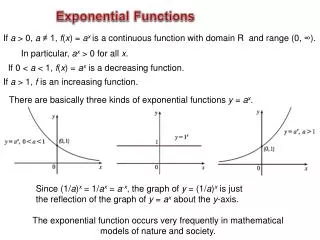
Vocabulary An exponential function has the form y = abx, where a ≠ 0 and the base b is a positive number other than 1. If a > 0 and b > 1, the function y = abx is an exponential growth function and b is called the growth factor.
Vocabulary An asymptote is a line that a graph approaches more and more closely (but will never actually touch!) The end behavior of a function’s graph is the behavior of the graph as x approaches positive or negative infinity.
Example 1: Graphy = 2x. STEP 1 Make a table of values. STEP 2 Plot the points from the table.
1 a. Plot and (1, 2) .Then, from left to right, draw a curve that begins just above the x-axis, passes through the two points, and moves up to the right. 2 0, EXAMPLE 2 Graph the function.
1,– x b. y = – 5 5 b. 2 2 Plot (0, –1) and . Then,from left to right, draw a curve that begins just below the x-axis, passes through the two points,and moves down to the right. EXAMPLE 2 Cont’d Graph the function. SOLUTION
Example 3 GraphState the domain and range. SOLUTION • Begin by sketching the graph y = 4 ● 2x • Then translate the graph: y = 4 ● 2x – 1 – 3
Example 3 Cont’d • Domain? • Range? • Asymptote?
Your Turn Graph each function below. State the Domain, range, and asymptote. y = 5x f(x) = 1/3 ● 4x y = 2x + 1 – 1
Your Turn: Answers Domain: all real #sRange: y > 0Asym.: y = 0 Domain: all real #sRange: y > 0Asym.: y = 0 Domain: all real #sRange: y > -1Asym.: y = -1
Vocabulary An exponential decay function has the form y = abx, where a > 0 and 0 < b < 1. The base b of an exponential decay function is called the decay factor.
Example 2 Graph y = -3(1/4)x. State the domain and range. Give the equation for the asymptote.
Example 3 Graph y = 2(2/3)x –1 + 1. State the domain and range. Give the equation for the asymptote.
Homework Worksheet!!!