Download
1 / 21
210 likes | 298 Views
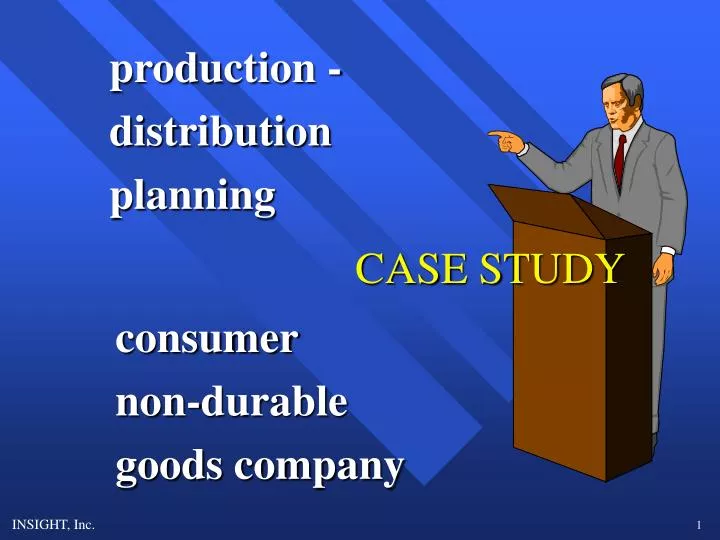
production - distribution planning. CASE STUDY. consumer non-durable goods company. ADF, INC. A manufacturer of consumer non-durable goods founded in 1927 Sales in 1980 were $460,000,000 There are twelve major categories of products, and two separate production technologies are employed

E N D
production - distribution planning CASE STUDY consumer non-durable goods company
ADF, INC. • A manufacturer of consumer non-durable goods founded in 1927 • Sales in 1980 were $460,000,000 • There are twelve major categories of products, and two separate production technologies are employed • There is a customer base of 11,000, placing 100,000 orders per year • In terms of customer service, the company seeks to maintain a 98% case fill rate with a 7-day order cycle time • To support this customer base at the beginning of 1980, there were 5 plants and 17 distribution centers
HISTORICAL SITUATION - 1930 J n Plant Distribution center Market area n J
HISTORICAL SITUATION - 1940 P1 n P1 n J Plant Distribution center Market area n J
HISTORICAL SITUATION - 1950 J J n J n P1 P1, P2 n P2 Plant Distribution center Market area n J
HISTORICAL SITUATION - 1960 J J n m n P1 J P1, P2 J n m P2 J J J Plant Distribution center Market area Local overflow warehouse n J m
HISTORICAL SITUATION - 1970 J J J n n P1 J P1, P2 J n P2 J J n P2 P1 n J J Plant Distribution center Market area n J J
HISTORICAL SITUATION - 1980 J J J J J n n P1 J P1, P2 J J J n P2 J J J J J n P1 J n P2 J Plant Distribution center Market area n J J
ADF DISTRIBUTION COST RELATIONSHIPS 1930 (est.) $ Transportation to Customers Transportation to Warehouse Inventory Carrying Costs Warehousing
ADF DISTRIBUTION COST RELATIONSHIPS 1980 $ Transportation to Customers Transportation to Warehouse Inventory Carrying Costs Warehousing
PD/Percent of COGS l 11.4% _ 10 Actual 8.2% _ l 8 6.5% l _ 6 PHYSICAL DISTRIBUTION COSTS GROWING FASTER THAN MANUFACTURING COSTS _ 4 _ 2 _ _ 1960 1970 1980
PHYSICAL DISTRIBUTION COSTS GROWING FASTER THAN SALES $463 MM Distribution P.D. Costs Percent of Sales 1970 - 5.8% 1980 - 8.0% Sales $138 MM $37 MM $8 MM 1970 1980
INVENTORY TURNOVER DECLINING Finished Goods Inventory Cost of Goods Sold $324 MM Inventory Turns 1970 - 7.5 1980 - 6.0 $97 MM $54 MM $13 MM 1970 1980
MANAGEMENT’S RESPONSES HAVE BEEN INCREMENTAL AND SUBOPTIMAL Impact on functional area Manufacturing costs Transportation costs Warehousing costs Inventory costs Customer service/sales Arbitrary inventory cuts Additional warehouses Mode mix changes Plant warehouse space usurped
MANAGEMENT OBJECTIVE • Fundamental question asked • by management . . . • what production-distribution network • will yield greatest return on assets, • given all trade-offs in the system?
SPECIFIC ISSUES • What are the appropriate customer service goals to pursue? • How should inventory be stratified and positioned in the various • echelons of the production - distribution system? • How many distribution centers should there be, where should they • be, and what service areas should be assigned to each? • Should new plant locations be opened and should the production • mix among plants be changed? • Which plants should provide which products to each warehouse • and what mix of transportation modes should be used?
RECONFIGURED SYSTEM J J J n n P1 P1, P2 n J P2 J n J J n P1, P2 P1 J n P2 J Plant Distribution center n Change in: J Plants 5 6 è Distribution Centers 17 9 è Distribution Center Replenishment Flows 22 6 è
FINANCIAL RESULTS • Reduction in distribution costs of 20% • (Fewer DC’s, less plant to DC freight and less inventory) • Increase in return on assets of 8% over an already • favorable 12.5% • Expect improvement in customer service/satisfaction • with more streamlined network and improved inventory • deployment
SOURCES OF SAVINGS Freight to warehouses Freight to customers Variable warehousing Inventory carrying cost Manufacturing Optimize flows in existing network Reconfigure network Market oriented plant Modify plant product mix Stratify customer service goals
OUTCOME OF SPECIFIC CONTINGENCY ANALYSES • IF • TL freight costs increase • disproportionately • LTL freight costs increase • disproportionately • Service level (order cycle time) • relaxed • Unit production cost estimates • at new plant low by >10% • Cost of money 10% (vs. 20%) • Then • West Coast plant more • advantageous • 3 more warehouses feasible • 1 less warehouse feasible • Logistics benefits of new • plant negated • 4 additional warehouses • feasible
THE NETWORK EVALUATION PROCESS Corporate policies/ strategies Manufacturing technology Service goals Raw material availability Marketing goals Future transportation costs Financial goals Optimization of existing network Alternate scenario definition Alternate scenario optimization Information development Validation Management analysis Valuable insight into current situation • Optimal resource • deployment • Plants • DC’s • Inventory • Optimal resource deployment • Production mix • DC-plant-customer assignments • Inventory deployment • Transportation Formulation of resource deployment strategy