Download
1 / 12
120 likes | 211 Views
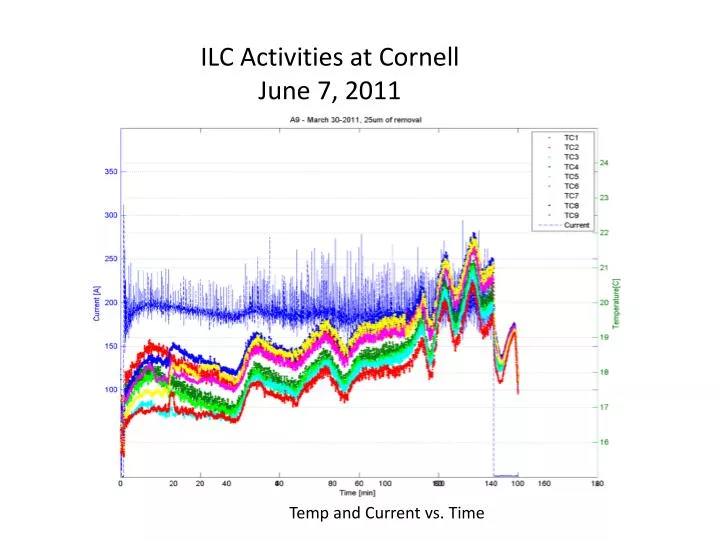
ILC Activities at Cornell June 7, 2011. Temp and Current vs. Time. Cavity testing: ILC cavity 9-cell A9. The cavity was VEP’d 25 micron with 17 volts; To improve Q value by increasing EP voltage from 14 to 17. The temperature < 22 °C. Temp and Current vs. Time.

E N D
ILC Activities at Cornell June 7, 2011 Temp and Current vs. Time
Cavity testing: ILC cavity 9-cell A9 The cavity was VEP’d 25 micron with 17 volts; To improve Q value by increasing EP voltage from 14 to 17. The temperature < 22 °C. Temp and Current vs. Time
The cavity quenched at 25.5 MV/m. The OST data suggests the cavity quenched at cell#1, the first bottom cell, equator region. The next plan of this cavity is optical inspection
VEP system at Cornell Universitywith Recirculation VEP 2.1: Recirculation
Temperature Oscillations: Experimental Setup • Resolution of thermocouples: 0.02°C • Agitation: 0.85Hz • Acid Recirculation(1Hz) • Location of thermocouples -> • 60 second window • Sample rate of • TC: 1.5 Hz • Current: 5 Hz Thermometers
Temperature Oscillations: Asymmetry VEP of AES2-1 Temperature Oscillations: Bottom Cup Temperature Oscillations: Top Cup
Interpretation • Frequency of top ≈ 2 * frequency of bottom • No obvious correlation between temperature & electrolyte motion • Upper cup • T increase correlated for Type 1 & Type 2 current spike • Lower Cup • T increase correlated with Type 2 current spike • T decrease correlated for Type 1 current spike • Meter stick for VEP development • Top and bottom oscillations must be identical • Further analysis on temperature/current correlation
Optical inspection at Cornell University A new camera LED Lighting A new 21.1 megapixels digital camera The resolution of system is 5 micron. A new bright lighting source (40 LED bulbs) By changing different arm and head, this system is able to make surface replica.
Cavity inspection result and surface profilometry scanning Optical inspection image from AES5 cell#1 3D surface scanned on replica by Laser confocal microscope at Fermilab The cavity quenched at 25MV/m the profile of pit A pit was found in ILC 9-cell cavity AES5 cell#1, 90 micron in depth, 700 micron in diameter.
Optical inspection image from A10 cell#4 500um The cavity quenched at 23MV/m
OST system at Cornell During the latest 9-cell cavity test, the 16 OST sensor shows clear signal, the program helps to calculate the quench location In the future, we will use 16 channels data acquisition card to capture signal simultaneously