Download
1 / 49
490 likes | 627 Views
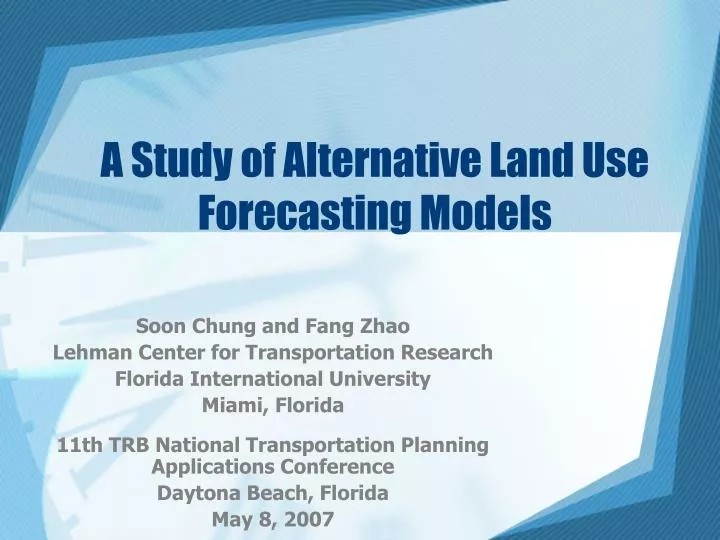
A Study of Alternative Land Use Forecasting Models. Soon Chung and Fang Zhao Lehman Center for Transportation Research Florida International University Miami, Florida 11th TRB National Transportation Planning Applications Conference Daytona Beach, Florida May 8, 2007. Acknowledgements.

E N D
A Study of Alternative Land Use Forecasting Models Soon Chung and Fang Zhao Lehman Center for Transportation Research Florida International University Miami, Florida 11th TRB National Transportation Planning Applications Conference Daytona Beach, Florida May 8, 2007
Acknowledgements • This project was funded by the Florida Department of Transportation Systems Planning Office • Terrence Corkery, AICP Project Manager • Mr. Michael Neihart, Volusia County MPO
Outline • Introduction • Objectives • UrbanSim • Study Area • Design of Simulation • Validation • Test Scenarios • Simulation Results • Findings
Introduction • Transportation models need good land use forecasts • Many land use models have been developed • Simple to complex • Integrated or not integrated • With/without economic theory basis • Support community visioning • GIS platform
Objectives • Understanding the state-of-the-art and state-of-the-practice of land use models • Determining the data requirements • Identifying application issues • Investigating need for data processing and interfacing FSUTMS • Identifying future research and implementation issues
What Is UrbanSim? • A land use microsimulation model • Developed by theUniversity of Washington • Provide new land use forecasting and analysis capabilities • Based on economic theories • Model the interactions of markets and policies, including dynamic disequilibrium • Design to interface activity-based models • Open Source software –source code free to use, modify, and redistribute (available at www.urbansim.org)
UrbanSim Users • US Users • Seattle • Eugene-Springfield • Houston • Honolulu • Salt Lake City • Phoenix • Detroit • Europe Users • Amsterdam • Paris • Zurich • Middle East Users – Tel Aviv • Potential Users - Downloaded from 80 Different Countries
Sub-Models • accessibility-model • household-transition-model • employment-transition-model • household-relocation-choice-model • employment-relocation-choice-model • household-location-choice-model • employment-non-home-based-location-choice-model • employment-home-based-location-choice-model • scaling-procedure-for-jobs-model • land-price-model • developer-model
Data Required • Grid Cells • Parcel Data • Property Tax Data • Employment Data (Info/USA) • Environmental Layers • Water • Wetlands • Floodplains • Parks and open space • National forests • Steep slopes (DEM) • Stream buffers (riparian areas) • Planning and Political Layers • Traffic Analysis Zones (TAZs) • Cities • Urban growth boundaries • Military • Major public lands • Tribal lands • Streets
Land Price Model • Linear Regression Model • Dependent Variable– natural logarithm of the total land value within a gridcell • Independent Variables • Site characteristics • Development type • Land use plan • Environmental constraints • Regional accessibility • Access to population and employment • Urban design-scale • Land use mix and density • Proximity to highways and arterials
Household Location Model • Discrete Choice Model • Variables • Housing Characteristics • Prices (cost to income ratio) • Development types (density, land use mix) • Housing age • Regional accessibility • Job accessibility by auto-ownership group • Travel time to CBD and airport • Urban design-scale (local accessibility) • Neighborhood land use mix and density • Neighborhood employment
Employment Location Model • Discrete Choice Model • Employment Home-Based Location Model • Employment Non-Home-Based Location Model • Variables • Real Estate Characteristics • Price • Development type (land use mix, density) • Regional accessibility • Access to population • Travel time to CBD, airport • Urban design-scale • Proximity to highway, arterials • Local agglomeration economies within and between sectors: center formation
DeveloperModel • Discrete Choice Model • Variables • Site characteristics • Existing development characteristics • Land use plan • Environmental constraints • Urban design-scale • Proximity to highway and arterials • Proximity to existing development • Neighborhood land use mix and property values • Recent development in neighborhood • Regional • Access to population and employment • Travel time to CBD, airport
Possible Scenarios • Macroeconomic Assumptions • Household and employment control totals • Development constraints • Can select any combination of • Political and planning overlays • Environmental overlays • Land use plan designation • Determine which development types cannot occur • Transportation infrastructure • User-specified events
Study Area Selection Criteria • Have recent household survey data • Up-to-date GIS data, including parcel-level property data • Being relatively self-contained
Volusia County • 1,263 square miles • Population – 443,343 in2000 • Surrounded by Flagler, Marion, Lake,Seminole, and Brevardcounties (most rural)
Households Jobs ZDATA1 ZDATA2 TranPlan UrbanSim Accessibility_Input Travel_Data Zones Composite Utility by Auto Ownership Highway Travel Times Simulation Process 1 2 3 4
Validation Model Output was compared with • Model results adopted in the LRTP • 2005 InfoUSA Employment Data
Cumulative Percentage of TAZs vs. Differences in Zonal Households and Population
Cumulative Percentage of Employment Differences between UrbanSim and the 2005 InfoUSA Data
Spatial Distribution of Differences between UrbanSim and 2005 InfoUSA Data
Five Scenarios • 3 alternatives from Volusia County 2020 LRTP • Alternative #2 • Alternative #3 • Final Plan • 3 projections (low, mid, high) of population from Bureau of Economic and Business Research
Spatial Distribution of Households from Scenario 12020 – Base Year
Spatial Distribution of Employment from Scenario 12020 – Base Year
Comparison of Households between the 2020 LRTP and Scenario1
Comparison of Employment between the 2020 LRTP and Scenario1
Spatial Distribution of Households from Scenario 22020 – Base Year
Spatial Distribution of Employment from Scenario 2 2020 – Base Year
Spatial Distribution of Households from Scenario 3 2020 – Base Year
Spatial Distribution of Employment from Scenario 32020 – Base Year
Findings • High data requirements • Impute missing data • Join property TAX data with parcel layer • Join employment data with parcel layer • Data mining and synthetic data cleaning tools, currentlybeing designed, will facilitate working with messy data • Model estimation requires knowledge of discrete choice models • Consultations with local government agencies are desirable in developing model specifications and estimating model parameters