Download
1 / 131
1.31k likes | 1.49k Views
Beta Findings for th e OMPS Nadir Mapper 1 st Guess Total Column Ozone (INCTO) and Nadir Profiler Ozone Profile (IMOPO ) Products. JPSS and NPP OMPS Teams. Outline (1). Beta Definition OMPS Background INCTO Performance Internal Evaluation

E N D
Beta Findings for the OMPSNadir Mapper 1stGuess Total Column Ozone (INCTO) andNadir Profiler Ozone Profile (IMOPO)Products JPSS and NPP OMPS Teams
Outline (1) • Beta Definition • OMPS Background • INCTO Performance • Internal Evaluation • Flags – Sun Glint y, XXX Ozone, etc. Distribution • Reflectivity Map, XXX Distribution • Total Column Ozone Map, XXX Latitude Zonal means • Aerosol Index XXX Map, Distribution, cross-track • Cross-Track Dependence • Geolocation of Small FOV • External Evaluation • Comparisons to OMPS V8TOZ • Comparisons to OMI and GOME-2 V8TOZ • Known Deficiencies • EDR LUT (CCR #343) • Snow/Ice Data not updated (DR #) • Cloud Top Pressure (CCR #385) • Partial Cloud Logic (CCR #419) • Day One Solar and Trending (CCR #411) • Dark and Smear (DR #4750) • Stray Light / Radiance Coefficients • Wavelength Scale
Outline (2) • IMOPO Performance • Internal Evaluation • Flags SAA, XXX tozcod, procod, • Initial and XXX Final Residuals • Reflectivity (also to INCTO) • Total Column Ozone (also to INCTO) • Ozone Profiles (Layer Amounts and Mixing Ratios) • External Evaluation • Comparisons to OMPS V8PRO (Mixing ratios) • Comparisons to SBUV/2 V8PRO • Known Deficiencies • Day One Solar and Trending (DR #) • Stray Light / Radiance Coefficients • Dark and Smear • Wavelength Scale • Update algorithm to V8PRO • Product Status • Summary of Findings and Recommendations • Promotion to Beta • Upgrades to V8TOZ and V8PRO • OMPS NM EDR: OOTCO
Outline (BU) • Irradiance Validation • Solar diffuser measurements • Radiance Validation • Signal-to-Noise • South Atlantic Anomaly – charged particle effects • Stray Light • Wavelength Scale • Radiance/Irradiance Validation • SDR Status • Summary of Findings and Recommendation
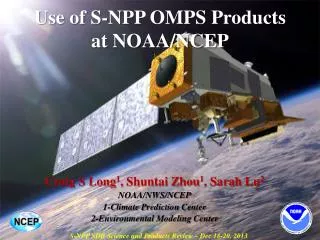
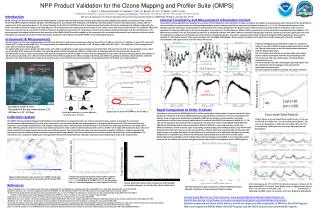
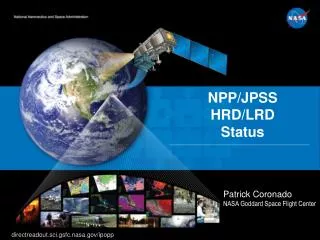
OMPS Fundamentals NOAA, through the Joint Polar Satellite System (JPSS) program, in partnership with National Aeronautical Space Administration (NASA), launched the Suomi National Polar-orbiting Partnership (Suomi NPP) satellite on October 28, 2011. The Ozone Mapping and Profiler Suite (OMPS) consists of two telescopes feeding three detectors measuring solar radiance scattered by the Earth's atmosphere and solar irradiance by using diffusers. The measurements are used to generate estimates of total column ozone and vertical ozone profiles. The total column sensor uses a single grating monochromator and a CCD array detector to make measurements every 0.42 nm from 300 nm to 380 nm with 1.0-nm resolution. It has a 110°cross-track FOV and 0.27° along-track slit width FOV. The measurements are currently combined into 35 cross-track bins: 3.35° (50 km) at nadir, and 2.84° at ±55°. The resolution is 50 km along-track at nadir, with a 7.6-second reporting period. The instrument is capable of making measurements with much better horizontal resolution. The nadir profile sensor uses a double monochromator and a CCD array detector to make measurements every 0.42 nm from 250 nm to 310 nm with 1.0-nm resolution. It has a 16.6° cross-track FOV, 0.26° along-track slit width. The current reporting period is 38 seconds giving it a 250 km x 250 km cell size collocated with the five central total column cells. The limb profile sensor is a prism spectrometer with spectral coverage from 290 nm to 1000 nm. It has three slits separated by 4.25° with a 19-second reporting period that equates to 125 km along-track motion. The slits have 112 km (1.95°) vertical FOVs equating to 0 to 60 km coverage at the limb, plus offsets for pointing uncertainty, orbital variation, and Earth oblateness. The CCD array detector provides measurements every 1.1 km with 2.1-km vertical resolution. The products for the Limb Profiler are not discussed here.
Instrument Fields of View. Schematic from Ball Aerospace and Technology Corporation.
Nadir Mapper & Profiler The instruments measure radiance scattered from the Earth’s atmosphere and surface. They also make solar measurements using pairs of diffusers. Judicious operation of working and reference diffusers allows analysts to track the diffuser degradation. The solar measurements also provide checks on the wavelength scale and bandpass. The instruments have completed multiple passes through their internal dark and nonlinearity calibration sequences and are beginning to make regular solar measurements. (See information on the OMPS SDRs.) Main Electronics Limb Profiler Diagram from Ball Aerospace and Technology Corporation Entrance Aperture Entrance Aperture Earth Mode Solar Mode Diffuser Each instrument can view the Earth or either of two solar diffusers; a working and a reference.
Typical spectra from 310 to 380 nm for OMPS Nadir Mapper. Solar Line Solar Irradiance Earth Radiance Ozone Absorption Features Radiance/Irradiance Ratio 310 380 Wavelength, nm
OMPS Nadir Mapper Spectra • The plot at the top of the preceding page shows a sample OMPS Nadir Mapper solar spectrum measured in January. The initial calibration, goniometry and wavelengths scales have been applied. Notice the Fraunhofer lines, e.g.,a deep one near 360 nm. • The plot in the middle shows a sample spectrum for the Earth View data for the nadir field-of view. • The plot on the bottom shows the ratio of the first two spectra. Notice that much of the structure in the solar spectrum cancels out in the ration. Also notice the variations between 320 and 330 nm produced by differential ozone absorption with wavelength.
Sun Glint Flags VIIRS Blue Marble January 23, 2012 This figure gives the location of pixels with the OMPS NMSun Glint flag set to 1 – viewing geometry has the potential for sun glint and the location is over open water – for the OMPS Nadir Mapper for March 5, 2012. The code is consistent in assigning this condition. (The VIIRS image in the upper left corner shows similar locations for Sun Glint but shifted to the South as the image is for Sun angles in January.)
Distribution of Non-Fill Effective Reflectivity Fewer than 1% of the 120000 values for this day are greater than 100 and only four values are less than 0. 2.5 % of the effective reflectivity have fill values with most of these for SZA >= 88 degrees and all with N-values with fill – no error flags are set for fill N-value cases.
OMPS NM Minimum Reflectivity Cross-Track Dependence (Need INCTO for March) |Lat|<20 Lon<-100 Black Week 1 Blue Week 2 Green Week 3 Red Week 4 Cross-track View Position
INCTO Cloud Top Pressure versus Latitude Cloud Pressure, Atmospheres Latitude, Degrees North
INCTO Cloud Top Pressure versus Latitude The slide on the previous page shows cloud top pressures versus latitude for three retrievals for February 26, 2012. The bottom one shows the cloud top pressures for INCTO with the at-launch climatology. The middle oneshows the cloud top pressures for INCOT with the new UV-based climatology. The top one shows the cloud top pressures for the Version 8 processing at STAR also with the new data. The new climatology gives new cloud pressures that are much lower (larger pressures) in the high latitudes of the Southern Hemisphere as the UV sees through thin cirrus. The switch to use this improved data set will be implemented in the near future.
OMPS NM INCTO Minimum Reflectivity Cross-Track Dependence The figure on the previous slide shows the weekly one-percentile effective reflectivity values for the month of February for all the data in a latitude/longitude box in the Equatorial Pacific versus cross-track view angle. (17 is the nadir position and 0 and 34 are the extreme viewing angles.) We expect this value to be approximately 4% from climatological measurements made by other instruments.
331-nm Channel Radiances for the first eight orbits of OMPS Nadir Mapper measurement (end of 1/26/2012 and start of 1/27/2012). This image shows the expected range of values and variations across the orbital track and with solar zenith angles at the times of the measurements. The white circle around the North Pole is the region of polar night during the Northern Hemisphere Winter. The OMPS needs scattered sunlight to make its measurements, so there are no data there. Figures: J. Niu, NOAA/STAR (ERT) 1/26-27/2012 Effective Reflectivity from the multiple triplet retrieval algorithm in IDPS for the same eight orbits. The quantity represents the UV reflectivity of the clouds and surface in each Field-of-View. Again, the range of values from bright clouds to dark open ocean scenes is as expected. • Total Ozone • from the multiple triplet retrieval algorithm in IDPS for the same eight orbits for the first pass ozone retrieval (IP product without CrIS or VIIRS information). The values show some cross track variations and are offset approximately 5% from another satellite ozone product. These uncertainty levels for preliminary products are consistent with the use of prelaunch calibration parameters and tables in the initial operational system.
Cross-Track Ozone Dependence 2% Total Ozone, DU |Lat|<20 Lon<-100 Black Week 1 Blue Week 2 Green Week 3 Red Week 4 Cross-track View Position March weekly-mean total column ozone (OMPS Nadir Mapper First-Guess Multiple-Triplet algorithm retrievals) as a function of the cross-track view angle for the region defined by 20S to 20N Latitude and 100W to 180W Longitude. The persistent cross-track bias could be caused by deficiencies in the initial calibration or solar data values. Position 16 is the nadir FOV and 0 and 31 are the extremes.
OMPS Geolocation This image shows the effective reflectivity for the 380-nm Channel for part of an orbit of small Field-of-View (5 KM X 10 KM at Nadir) made by the OMPS Nadir Mapper in a special diagnostic mode. The Qatar peninsula sticking into the Persian Gulf in the middle of the picture lies along the nadir view of the orbital track and gives a preliminary assurance of the geolocation at better the 5 KM. C. Seftor, NASA/GSFC (SSAI) 1/26-27/2012
(a) (c) (b) Daily Total Column Ozone map comparisons between (a) IDPS OMPS First Guess Multiple Triplet product, (b) NOAA OMPS V8 product, and (c ) NASA OMI V8.6 product for March 30, 2012. Cross-track features in OMPS products are related to the use of preliminary calibration values. DU 100 300 500
February weekly-mean total column ozone (OMPS Nadir Mapper First-Guess Multiple-Triplet algorithm retrievals) as a function of the cross-track view angle for the region defined by 20S to 20N Latitude and 100W to 180W Longitude. The persistent cross-track bias could be caused by deficiencies in the initial calibration or solar data values. Position 16 is the nadir FOV and 0 and 31 are the extremes. Red OMPS Blue GOME-2 Black N19 SBUV/2 Green N18 SBUV/2 Total ozone, DU (a) Comparison of daily mean total column ozone estimates from SBUV/2 NOAA-18 (BLACK) & NOAA-19 (GREEN), NPP OMPS NM (RED) and MetOP-A GOME-2 NOAA V8 Processing (BLUE) for February 2012 for a latitude/longitude box in the Equatorial Pacific. (b) (c) DU 100 300 500
SAA Effects on NP and NM The noise/spikes below show the expected increases when an orbital path falls with within the SAA but return to normal levels after passing through it. Examination of South Atlantic Anomaly (SAA) effects and product flagging. The OMPS was designed to use the OMPS Limb Profiler retrievals in the SAA where the OMPS Nadir Profiler is affected by charged particles and cannot be used to produce ozone profiles. Map of South Atlantic Anomaly effects on OMPS NM closed-door dark current measurements in December and November 2011, overlaid with OMPS NP SAA Flags (0 to 8) for 3/5-6/2012
Residuals Daily zonal means for 20ºS to 20ºN (avoiding SAA effects by excluding longitudes from 0 to 90 West) for initial measurement residuals for the three shortest wavelengths (252, 274 and 283 nm) from the operational NOAA-18 (BLACK) & 19 (BLUE) SBUV/2 and the STAR NPP OMPS NP (RED) Version 8 ozone profile retrieval algorithm for February and March of 2012. The OMPS values are offset due to the use of a preliminary solar calibration and the lack of stray light corrections.
Slides for Ivan NPP Science Team Maturity Matrix Time Line ICVS Content http://www.star.nesdis.noaa.gov/smcd/spb/icvs/proComparison.php http://www.star.nesdis.noaa.gov/smcd/jcsda/nsun/NPP/ipm_telemetry_npp_omps.php Product upgrades near term Limited Validation Products Longer Term NPP ST Synetgy
Plots for Ivan • Maps of INCTO, OOTCO, V8TOZ, OMI, GOME-2 • Comparison of ozone profiles IMOPO, V8PRO, N18, N19
OMPS Slides for Ivan’s NPP Science Team OverviewNote: Slide 3 has three layers set to fade in sequentially.I will have an OMPS poster there as well.
OMPS Total Ozone Status • IDPS is processing OMPS Nadir Mapper data with two versions of the Multiple Triplet Algorithm (an extension of the TOMS V7 algorithm) – a first guess product (INCTO) and a second pass product (OOCTO). The second pass product uses NRT information from the VIIRS and CrIS Instruments • A Beta maturity level findings meeting is planned for later this month for the INCTO product • NOAA STAR is processing OMPS Nadir Mapper data with the Version 8 Algorithm • A new Day One solar file will be implemented in IDPS by Mx7 at the latest
OMPS Nadir Profiler Status • IDPS is processing OMPS Nadir Profiler and Nadir Mapper Measurements with the Version 6 SBUV(/2) algorithm (IMOPO) • A Beta maturity level findings meeting is planned for later this month for the IMOPO product • NOAA STAR is processing the data with the Version 8 SBUV/2 algorithm • A new Day One solar file will be implemented in IDPS by Mx7 at the latest • We are working on a Stray Light correction
Additional Information on OMPS • Near term work on the total ozone products includes: • Evaluation of reflectivity and aerosol index products • Evaluation of cross track consistency • Modeling of along orbit wavelength scale variations • Daily Maps of the OMPS INCTO and V8TOZ are available to Science Team Members at • http://www.star.nesdis.noaa.gov/smcd/spb/icvs/proComparison.php • Near term work on the ozone profile products includes: • Comparison of profiles and initial residuals to SBUV/2 • Modeling of stray light for the Nadir Profiler channels • Information on IMOPO and V8PRO will be made available soon at • http://www.star.nesdis.noaa.gov/smcd/spb/icvs/proSBUV2operational.php
OMPS Ozone Products Maturity Matrix C C C C C C C C C C C C C C C C C C C C C C C C C C C C C C C C C C C C C C C C C C C C C C C C C C C C C C C C C C C C C C C C C C C C C C C C C C C C C C C C C C C C C C C C C C C C C C C C C C C C C C C C C C C C C C C C C C C C C C C C C C C C C C C C C C C C C C C C C C C C C C C C C C
Outline • Day 1 Solar and Radiometric Coefficients • Wavelength Scale • Geolocation Registration • NM 1st Guess IP (Repeat for MT EDR and V8 EDR) • Reflectivity • Range and Error Flags • Pacific Box – Cross-track • Comparisons • Ozone • Range and Error Flags • Pacific Box – Cross-track • Comparisons • Aerosol Index • Range • Pacific Box – Cross-track • Comparisons • NP Ozone Profile V6 • Total ozone • Ozone Profile • V8 Initial Residuals • Stray Light • South Atlantic Anomaly – charged particle effects
Outline (2) • NP Ozone Profile V6 • Total ozone • Ozone Profile • V8 Initial Residuals • Stray Light • South Atlantic Anomaly – charged particle effects
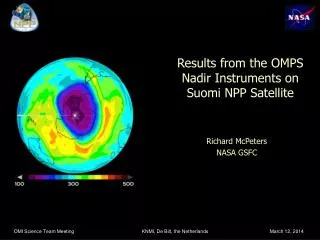
These maps show false color plots of the total column ozone estimated from OMPS Nadir Mapper measurements for March 5, 2012. The top map shows the First Guess product from IDPS processing. The lower map shows a processing with the Version 8 algorithm at STAR. Both maps show cross-track bias patterns but generally detect the appropriate global ozone variations. (Figures created by W. Yu, ERT.)
List of Golden Day Datasets • OMPS NM: SOMTC, GOMTC, OOMTC, INCTO • OMPS NP: SONPS, IMOPO, GONPO • Calibration SDRs? • GOME-2 data, Level 1, 2, 3 • SBUV/2 data, Level 1, 2 • Assimilations? • Ground-based • CrIS O3 IP? • OMI Level 3 Ozone, aerosol and reflectivity?