Download
1 / 31
600 likes | 1.06k Views
MOTION GRAPHS. CREATING AND INTERPRETING GRAPHS. WHAT DO WE KNOW. On the paper provided, write down everything you know about graphs and graphing. Components of the Graph R eview. X- axis and Y-axis Scale and Variables Title How do you determine Scale Maximize the graph paper .

E N D
MOTION GRAPHS CREATING AND INTERPRETING GRAPHS
WHAT DO WE KNOW • On the paper provided, write down everything you know about graphs and graphing
Components of the GraphReview • X- axis and Y-axis • Scale and Variables • Title • How do you determine • Scale • Maximize the graph paper
Interpreting Graphs The purpose of a graph is to show a RELATIONSHIP between 2 variables • Positive Relationships: • As one variable increases, so does the other • Conversely, as one variable decreases, so does the other.
On your paper DRAW AN X AND Y AXIS AND THEN PLOT A LINE THAT SHOWS A POSITIVE RELATIONSHIP
Interpreting Graphs 2. Negative or Inverse Relationships: • As one variable increases, the other decreases • Conversely, as one variable decreases the other increases.
On your paper DRAW AN X AND Y AXIS AND THEN PLOT A LINE THAT SHOWS A NEGATIVE/INVERSE RELATIONSHIP
Line of Best Fit Line of Best Fit: Straight line drawn through linear data. • The line does not necessarily connect the data points but is drawn through the majority of points, with an equal number of points above and below the line.
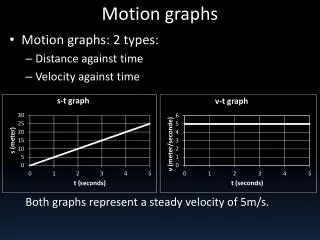
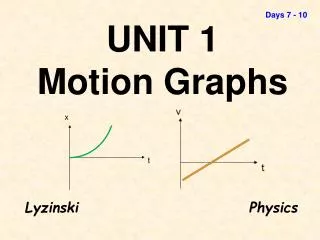
MOTION GRAPHS Graphs that deal with motion will have the following variables on their X and Y axis: Distance/Position Time Speed Acceleration Distance and time will be used to calculate speed and/or acceleration
Distance, Time and Speed • Distance is the amount of space BETWEEN 2 objects. • Time is an interval that has a beginning and an end • Speed is the distance an object travels in a specific amount of time. • Constant speed is the same distance is traveled every second or time interval
Relationship Speed is directly related to distance traveled
Relationship Speed is indirectly/inversely related to the amount of time
Position-Time Graphs On your paper explain how to find the speed of a car using a position-time graph
Constant Speed • Position vs Time graphs will have a straight line when the object is traveling at a constant speed. Slope = Speed
Changing Speed • A position vs time graph will have a curve when the object is traveling at a changing speed, steepness of the curve will indicate just how fast object is changing speed.
Calculating Speed v = d/t v = velocity or speed of an object d = distance traveled t = time that it took to travel that particular distance Units for speed are distance per unit of time -or- m/sec -or- km/hr
Solve these problems Use your notes to help you • If a car travels 40 km in a time period of 2 minutes, what is its speed? • If a car travels 60 km at 20 km/hr, how long does it take?
What is the relationship between speed and time (use your notes!)
Speed-Time Graphs for Acceleration • Rate of change in an object’s speed • Slope = Acceleration • When you plot speed vs. time, you now have the acceleration of an object.
Distance from Speed vs. Time Graph • Distance is equal to speed x time • The area of a graph represents speed x time • Therefore the area below the line of best fit is the distance traveled
Draw a speed-time graph that shows an object that is moving at a constant speed
Sample Graph • What will be on the X-Axis? • What will be on the Y-Axis? • Name the 3 different types of graphs and then state which you will make for this set of data.