Download
1 / 34
370 likes | 512 Views
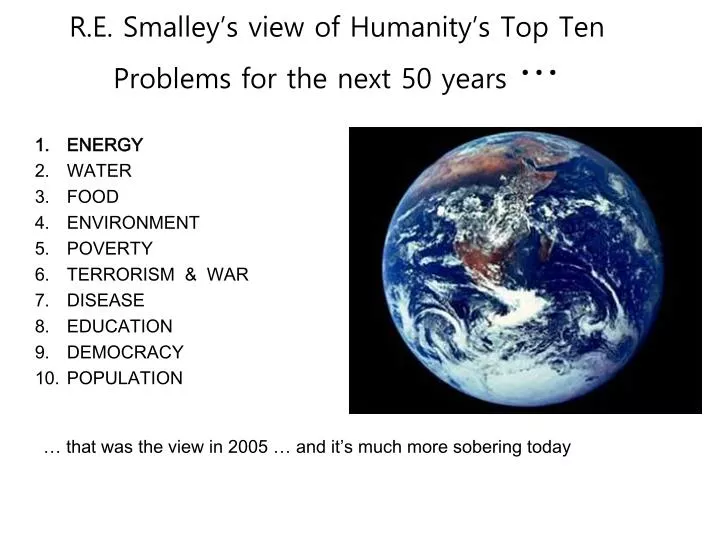
R.E. Smalley’s view of Humanity’s Top Ten Problems for the next 50 years …. ENERGY WATER FOOD ENVIRONMENT POVERTY TERRORISM & WAR DISEASE EDUCATION DEMOCRACY POPULATION. … that was the view in 2005 … and it’s much more sobering today. The Biggest Challenge. Energy

E N D
R.E. Smalley’s view of Humanity’s Top Ten Problems for the next 50 years … • ENERGY • WATER • FOOD • ENVIRONMENT • POVERTY • TERRORISM & WAR • DISEASE • EDUCATION • DEMOCRACY • POPULATION … that was the view in 2005 … and it’s much more sobering today
The Biggest Challenge Energy For 1010 People • At MINIMUM we need 10 Terawatts (150 M BOE/day) • from some new clean energy source by 2050 • It’s got to be cheap. • But, not with current technology.
World Energy Millions of Barrels per Day (Oil Equivalent) 300 200 100 0 1860 1900 1940 1980 2020 2060 2100 Source: John F. Bookout (President of Shell USA) ,“Two Centuries of Fossil Fuel Energy” International Geological Congress, Washington DC; July 10,1985. Episodes, vol 12, 257-262 (1989).
165,000 TW of sunlight hit the earth Free!
The ENERGY REVOLUTION (The Terawatt Challenge) 14.5 Terawatts 220 M BOE/day 30 - 60 Terawatts 450 - 900 MBOE/day The Basis of Prosperity 20st Century = OIL 21st Century = ?? Slide from: R. E. Smalley, Rice University
Remaining Oil Resources 8 ZJ/0.18 ZJ/yr = 44 yr 19 ZJ/0.2 ZJ/yr = 95 yr 35 ZJ/0.2 ZJ/yr =175 yr 2005 Oil consumption was 0.18 ZJ/yr = 44 yr
Available renewable energy 15/86000= 0.017% 2008 Total World Energy Consumption 474 EJ(1018 J = 0.5 ZJ)/yr = 133 Petawatt•hr(132.8×10¹⁵ Wh) =~15 TW
에너지 • 에너지 : 일을 할 수 있는 능력 -에너지의 종류 : 운동 에너지, 퍼텐셜 에너지, 화학 에너지, 전기 에너지, 열에너지 등 -에너지의 단위 : J(joule)을 사용 • 일과 에너지의 관계 -물체에 일을 해 주면 에너지 증가 -물체가 일을 하면 에너지 감소
에너지 단위-2 • 1 barrel (bbl) of crude oil = 42 gallons = 6.12 x 10⁹ joules • 1 MToe = million tons of oil, equivalent = 1013 joules
Commercial Energy Use & GNP ENERGY CONSUMPTION(106 BTU/YEAR/CAPITA) GROSS NATIONAL PROCUCT($US/CAPITA)
Commercial Energy Use & GNP GROSS DOMESTIC PROCUCT($US/CAPITA) ENERGY CONSUMPTION(kW/CAPITA)
White’s Law “Culture advances as the quantity and quality of energy used increases. This relationship can be captured formally as an equation.” C = k x E x T Leslie White, 1973 C = culture E = energy T = technology k = scaling (efficiency) constant
Resource DepletionHubbert (1956) production would begin with exponential growth, then plateau, then decline (symmetrically) as in bell curve:
Annual Production Scenarios with 2% Growth Rates and Different Decline Methods
Wind Turbines Top 10 windpower capacity countries(2010) 참고: 한국의 총 발전설비용량 76,078MW(2010)
Total renewables supply experienced an annual growth rate of 2.3% over the last 33 years, marginally higher than the annual growth of 2.2% in TPES. However, the “other” category in Figure 2 (also referred to as “new” renewables and including geothermal, solar, wind, etc.) recorded a much higher annual growth of 8.2%. Due to a very low base in 1971 and to recent fast-growing development, wind experienced the highest increase (+48% p.a.) followed by solar (+28% p.a.).
Photovoltaics: costs have declined by two orders of magnitude… Nemet, G. F. (2006). "Beyond the learning curve: factors influencing cost reductions in photovoltaics.“ Energy Policy 34(17): 3218 - 3232.
The Solar Market in Kenya –Use of solar emerged in 1980’s -lessons from two decades of experience –Market is largely unsubsidized the world's highest household solar ownership rate with roughly 30,000 small (20 to 100 watt) solar power systems sold per year.
Aerodynamic 3 Accessories 2 13 Rolling 4 Standby 17 Braking 6 Fuel 100 19 Drive Train Loss 6 Engine Loss 62
Aerodynamic 11 Accessories 2 20 Rolling 7 Standby 4 Braking 2 Fuel 100 25 Drive Train Loss 5 Engine Loss 69
Vehicle Efficiency Internal combustion engine η = 1 – (Tcold/Thot) Alternative Fuel Engine Ethanol Biodiesel Octane Rate MTBE
Advanced Vehicles Volkswagen One-Liter Car Aptera Electric/Hybrid
Advanced Vehicles 80 km/l on the combined cycle, 39g CO2/km Volkswagen L1 Diesel-Electric Car Toyato Prius 99mph top speed, 0-60mph 14.2sec, two-cylinder, 800cc, diesel-electric hybrid engine, 380kg carbon fibre and aluminium body 48 MPG city/45 highway/46 combined