1 / 0

LP Formulation Set 2

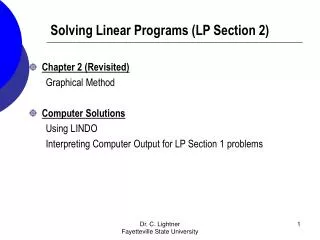
LP Formulation Set 2. Problem (From Hillier and Hillier) . Strawberry shake production Several ingredients can be used in this product . Ingredient calories from fat Total calories Vitamin Thickener Cost

lel
Download Presentation

LP Formulation Set 2

An Image/Link below is provided (as is) to download presentation Download Policy: Content on the Website is provided to you AS IS for your information and personal use and may not be sold / licensed / shared on other websites without getting consent from its author. Content is provided to you AS IS for your information and personal use only. Download presentation by click this link. While downloading, if for some reason you are not able to download a presentation, the publisher may have deleted the file from their server. During download, if you can't get a presentation, the file might be deleted by the publisher.

E N D

Presentation Transcript


  1. LP FormulationSet 2

  2. Problem (From Hillier and Hillier) Strawberry shake production Several ingredients can be used in this product. Ingredient calories from fatTotal caloriesVitaminThickener Cost ( per tbsp) (per tbsp) (mg/tbsp) (mg/tbsp)( c/tbsp) Strawberry flavoring 1 50 20 3 10 Cream 75 100 0 8 8 Vitamin supplement 0 0 50 1 25 Artificial sweetener 0 120 0 2 15 Thickening agent 30 80 2 25 6 This beverage has the following requirements Total calories between 380 and 420. No more than 20% of total calories from fat. At least 50 mg vitamin. At least 2 tbsp of strawberry flavoring for each 1 tbsp of artificial sweetener. Exactly 15 mg thickeners. Formulate the problem to minimize costs.
  3. Decision variables Decision Variables X1 : tbsp of strawberry X2 : tbsp of cream X3 : tbsp of vitamin X4 : tbsp of Artificial sweetener X5 : tbsp of thickening
  4. Constraints Objective Function Min Z = 10X1 + 8X2 + 25X3 +15X4 + 6X5 Calories 50X1 + 100 X2 + 120 X4 + 80 X5  380 50X1 + 100 X2 + 120 X4 + 80 X5  420 Calories from fat X1 + 75 X2 + 30 X5  0.2(50X1 + 100 X2 + 120 X4 + 80 X5) Vitamin 20X1 + 50 X3 + 2 X5  50 Strawberry and sweetener X1  2 X4 Thickeners 3X1 + 8X2 + X3 +2X4 + 2.5X5= 15 Non-negativity X1 , X2 , X3 , X4 ,X5  0
  5. Agricultural planning : narrative Three farming communities are developing a joint agricultural production plan for the coming year. Production capacity of each community is limited by their land and water. Community Land (Acres) Water (Acres Feet) 1 400 600 2 600 800 3 300 375 The crops suited for this region include sugar beets, cotton, and sorghum. These are the three being considered for the next year. Information regarding the maximum desired production of each product, water consumption , and net profit are given below
  6. Agricultural planning : narrative Crop Max desired Water consumption Net return (Acres) (Acre feet / Acre) ($/Acre) 1 600 3 1000 2 500 2 750 3 325 1 250 Because of the limited available water, it has been agreed that every community will plant the same proportion of its available irritable land. For example, if community 1 plants 200 of its available 400 acres, then communities 2 and 3 should plant 300 out of 600, and 150 out of 300 acres respectively. However, any combination of crops may be grown at any community. Goal : find the optimal combination of crops in each community, in order to maximize total return of all communities
  7. Agricultural planning : decision variables x11 = Acres allocated to Crop 1 in Community 1 x21 = Acres allocated to Crop 2 in Community 1 x31 = Acres allocated to Crop 3 in Community 1 x12 = Acres allocated to Crop 1 in Community 2 x22 = Acres allocated to Crop 2 in Community 2 x32 = Acres allocated to Crop 3 in Community 2 …………….. xij = Acres allocated to Crop i in Community j i for crop j for community, we could have switched them Note that x is volume not portion, we could have had it as portion
  8. Agricultural planning : Formulation Land x11+x21+x31  400 x12+x22+x32  600 x13+x23+x33  300 Water 3x11+2x21+1x31  600 3x12+2x22+1x32  800 3x13+2x23+1x33  375
  9. Agricultural planning : Formulation Crops x11+ x12 + x13  600 x21 +x22 +x23   500 x31 +x32 +x33   320 Proportionality of land use x11+x21+x31 x12+x22+x32 400 600 x11+x21+x31 x13+x23+x33 400 300
  10. Agricultural planning : Formulation Crops x11+ x12 + x13  600 x21 +x22 +x23   500 x31 +x32 +x33   320 Proportionality of land use x11+x21+x31 x12+x22+x32 400 600 x11+x21+x31 x13+x23+x33 400 300
  11. Agricultural planning : all variables on LHS Proportionality of land use 600(x11+x21+x31 ) - 400(x12+x22+x32 )= 0 300(x11+x21+x31 ) - 400(x13+x23+x33 )= 0 600x11+ 600 x21+ 600 x31 - 400x12- 400 x22- 400 x32 = 0 300x11+ 300 x21+ 300 x31 - 400x13- 400 x23- 400 x33 = 0 x11, x21,x31, x12, x22, x32, x13, x23, x33  0
  12. Controlling air pollution : narrative This is a good example to show that the statement of a problem could be complicated. But as soon as we define the correct decision variables, things become very clear Two sourcesof pollution: Open furnaceand Blast furnace Threetypes of pollutants: Particulate matter, Sulfur oxides, and hydrocarbons. ( Pollutant1, Pollutant2, Pollutant3). Required reduction in these 3 pollutants are 60, 150, 125 million pounds per year. ( These are RHS) Threepollution reduction techniques: taller smokestacks, Filters, Better fuels. ( these are indeed our activities). We may implement a portion of full capacity of each technique. If we implement full capacity of each technique on each source, their impact on reduction of each type of pollutant is as follows
  13. Controlling air pollution : narrative Pollutant Taller FilterBetter fuel smokestacks B.F. O.F B.F. O.F. B.F. O.F. Particulate 12 9 25 20 17 13 Sulfur 35 42 18 31 56 49 Hydrocarb. 37 53 28 24 29 20 The cost of implementing full capacity of each pollutant reduction technique on each source of pollution is as follows Pollutant Taller FilterBetter fuel smokestacks B.F. O.F B.F. O.F. B.F. O.F. Cost 12 9 25 20 17 13
  14. Controlling air pollution : Decision Variables How many techniques?? How many sources of pollution??How many constraints do we have in this problem??? How many variables do we have Technique i source j
  15. Controlling air pollution : Decision Variables x11 = Proportion of technique 1 implemented of source 1 x12 = Proportion of technique 1 implemented of source 2 x21 = Proportion of technique 2 implemented of source 1. x22 = Proportion of technique 2 implemented of source 2 x31 = Proportion of technique 3 implemented of source 1 x32 = Proportion of technique 3 implemented of source 2.
  16. Controlling air pollution : Formulation Pollutant Taller FilterBetter fuel smokestacks B.F. O.F B.F. O.F. B.F. O.F. Particulate 12 9 25 20 17 13 Sulfur 35 42 18 31 56 49 Hydrocarb. 37 53 28 24 29 20 Min Z= 12x11+9x12+ 25x21+20x22+ 17x31+13x32 Particulate; 12x11+9x12+ 25x21+20x22+ 17x31+13x32 60 Sulfur; 35x11+42x12+ 18x21+31x22+ 56x31+49x32 150 Hydrocarbon; 37x11+53x12+ 28x21+24x22+ 29x31+20x32 125 x11, x12, x21, x22, x31, x32 ????
  17. SAVE-IT Company : Narrative A reclamation center collects 4 types of solid waste material, treat them, then amalgamate them to produce 3 grades of product. Techno-economical specifications are given below Grade Specifications Processing Sales price cost / pound / pound M1 :  30% of total A M2 :  40% of total 3 8.5 M3 :  50% of total M4 : exactly 20% M1 :  50% of total B M2 :  10% of total 2.5 7 M4 : exactly 10% C M1 :  70% of total 2 5.5
  18. SAVE-IT Company : Narrative Availability and cost of the solid waste materials M1, M2, M3, and M4 per week are given below Material Pounds available / week Treatment cost / pound M1 3000 3 M2 2000 6 M3 4000 4 M4 1000 5 Due to environmental considerations, a budget of $30000 / week should be used to treat these material. Furthermore, for each material, at least half of the pounds per week available should be collected and treated.
  19. SAVE-IT Company : Mixture Specification A1: weight of solid waste 1 in grade A A1, A2, A1, A4, B1, B2, B3, B4, C1, C2, C3, C4 Mixture Specifications: Grade A: A1  0.3 (A1+A2+A3+A4) A2  0.4 (A1+A2+A3+A4) A3  0.5 (A1+A2+A3+A4) A3 = 0.2 (A1+A2+A3+A4) Grade B: B1  0.5(B1+B2+B3+B4) B2  0.1(B1+B2+B3+B4) B4 = 0.1(B1+B2+B3+B4) Grade C: C1  0.3 (C1+C2+C3+C4)
  20. SAVE-IT Company : Material Availability and ussage Availability of material A1+B1+C1  3000 A2+B2+C2  2000 A3+B3+C3  4000 A4+B4+C4  1000 At least half of the material treated A1+B1+C1  1500 A2+B2+C2  1000 A3+B3+C3  2000 A4+B4+C4  500
  21. SAVE-IT Company : Treatment and Processing Costs, and Profit Spend all the treatment budget 3(A1+B1+C1)+6(A2+B2+C2)+4(A3+B3+C3)+5(A4+B4+C4) =30000 Maximize profit Z (8.5-3)(A1+A2+A3+A4)+(7-2.5) (B1+B2+B3+B4)+(5.5-2) (C1+C2+C3+C4) – 3(A1+B1+C1)-6(A2+B2+C2)-4(A3+B3+C3)-5(A4+B4+C4)) A1, A2, A1, A4, B1, B2, B3, B4, C1, C2, C3, C4 0
  22. Capital budgeting : Narrative representation We are an investor, and there are 3 investment projects offered to the public. We may invest in any portion of one or more projects. Investment requirements of each project in each year ( in millions of dollars) is given below. The Net Present Value (NPV) of total cash flow is also given. Year Project 1 Project 2 Project 3 0 40 80 90 1 60 80 60 2 90 80 20 3 10 70 60 NPV 45 70 50
  23. Capital budgeting : Narrative representation If we invest in 5% of project 1, then we need to invest 2, 3, 4.5, and 0.5 million dollars in years 0, 1, 2, 3 respectively. The NPV of our investment would be also equal to 5% of the NPV of this project, i.e. 2.25 million dollars. Year Project 1 5% of Project 1 0 40 2 1 60 3 2 90 4.5 3 10 .5 NPV 45 2.25
  24. Capital budgeting : Narrative representation Based on our budget forecasts, Our total available money to invest in year 0 is 25M. Our total available money to invest in years 0 and 1 is 45M Our total available money to invest in years 0, 1, 2 is 65M Our total available money to invest in years 0, 1, 2, 3 is 80M To clarify, in year 0 we can not invest more than 25M. In year 1 we can invest 45M minus what we have invested in year 0. The same is true for years 2 and 3. The objective is to maximize the NPV of our investments
  25. Capital budgeting : Formulation x1 = proportion of project 1 invested by us. x2 = proportionof project 2 invested by us. x3 = proportionof project 3 invested by us. Maximize NPV Z = 45x1 + 70 x2 + 50 x3 subject to Year 0 : 40 x1 + 80 x2 + 90 x3  25 Year 1 :Investment in year 0 + Investment in year 1  45
  26. Capital budgeting : Formulation Investment in year 0 = 40 x1 + 80 x2 + 90 x3 Investment in year 1 = 60 x1 + 80 x2 + 60 x3 Year 1 : 60 x1 + 80 x2 + 60 x3 + 40 x1 + 80 x2 + 90 x3 45 Year 1 : 100x1 + 160 x2 + 150 x3 45 Year 2 : 90x1 + 80x2 + 20 x3+ 100x1 + 160 x2 + 150 x3  65 Year 2 : 190x1 + 240x2 + 170 x3 65 Year 3 : 10x1 + 70x2 + 60 x3 +190x1 + 240x2 + 170 x3 80 Year 3 : 200x1 + 310x2 + 230 x3  80 x1 , x2, x3 0.
  27. Personnel scheduling problem : Narrative representation An airline reservations office is open to take reservations by telephone 24 hours per day, Monday through Friday. The number of reservation officers needed for each time period is: Period Requirement 12am-4am 11 4am-8am 15 8am-12pm 31 12pm-4pm 17 4pm-8pm 25 8pm-12am 19 The union requires all employees to work 8 consecutive hours. Therefore, we have shifts of 12am-8am, 4am-12pm, 8am-4pm, 12pm-8pm, 4pm-12am, 8pm-4am. Hire the minimum number of reservation agents needed to cover all requirements.
  28. Personnel scheduling problem : Narrative representation The union contract requires all employees to work 8 consecutive hours. We have shifts of 12am-8am, 4am-12pm, 8am-4pm, 12pm-8pm, 4pm-12am, 8pm-4am. Hire the minimum number of reservation agents needed to cover all requirements. If there were not restrictions of 8 hrs sifts, then we could hire as required, for example 11 workers for 4 hors and 15 workers for 4 hours.
  29. Personnel scheduling problem : Pictorial representation Period Shift 1 2 3 4 5 6 11 15 31 17 25 19 12 am to 4 am 4 am to 8 am 8 am to 12 pm 12 pm to 4 pm 4 pm to 8 pm 8 pm to 12 am
  30. Personnel scheduling problem : Decision variables x1 = Number of officers in 12 am to 8 am shift x2 = Number of officers in 4 am to 12 pm shift x3 = Number of officers in 8 am to 4 pm shift x4 = Number of officers in 12 pm to 8 pm shift x5 = Number of officers in 4 pm to 12 am shift x6 = Number of officers in 8 pm to 4 am shift
  31. Personnel problem : constraints and objective function Min Z = x1+ x2+ x3+ x4+ x5+ x6 12 am - 4 am : x1 +x6  11 4 am - 8 am : x1 +x2  15 8 am - 12 pm : +x2 +x3  31 12 pm - 4 pm : +x3 +x4  17 4 pm - 8 pm : +x4 +x5  25 8 pm - 12 am : +x5 +x6  19 x1 , x2, x3, x4, x5, x6 0.
  32. Personnel scheduling problem : excel solution
  33. Aggregate Production Planning : Narrative PM Computer Services assembles its own brand of computers. Production capacity in regular time is 160 computer / week Production capacity in over time is 50 computer / week Assembly and inspection cost / computer is $190 in regular time and $260 in over time. Customer orders are as follows Week 1 2 3 4 5 6 Orders 105 170 230 180 150 250 It costs $10 / computer / week to produce a computer in one week and hold it in inventory for another week. The Goal is to satisfy customer orders at minimum cost.
  34. Refresh We need to lease warehouse space. The estimated required space ( in 1000 sqft) is given below. Month 1 2 3 4 5 Space required 30 20 40 10 50 If the leasing cost was fixed the best strategy was to lease as needed. But this is not the case Leasing period (months) 1 2 3 4 5 Cost per sq-feet leased 65 100 135 160 190 Now it may be more economical to lease for more than one month and take advantage of the lower rates for longer periods. Find the optimal leasing strategy to minimize leasing costs.
  35. Decision Variables Xij spaced leased in month i and kept until month j months. i = 1, 2, 3, 4, 5. j= i, i+1, …, 5 Min z = 65X11 +100 X12 +135 X13 +160 X14+190 X15 + 65X22+100 X23 +135 X24 +160 X25 + 65X33+100 X34 +135 X35 + 65X44+100 X45 + 65X55
  36. Constraints X11 + X12 + X13 + X14+ X15 30,000 X12 + X13 + X14+ X15 +X22+ X23 + X24 + X25 20,000 X13 + X14+ X15 +X23 + X24 + X25+X33+ X34 + X35  40,000 X14+ X15 + X24 + X25+ X34 + X35 +X44+ X45 10,000 X15 + X25+ X35 + X45+X55  50,000 X11 , X12 , X13 , X14 , X15 , X22 , X23 , X24 , X25,X33 , X34 , X35 X44 , X45 ,X55  0
  37. excel; Format 1
  38. excel; Format 2
  39. excel; Best Format (Ctrl)
More Related