Download
1 / 32
320 likes | 471 Views
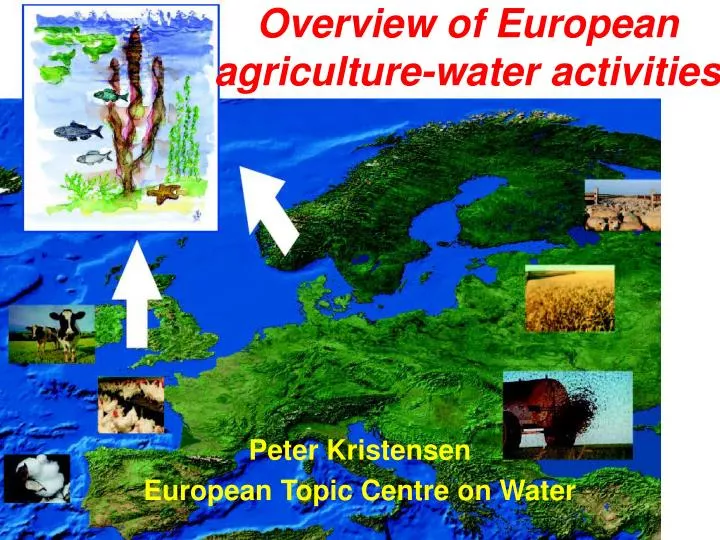
Overview of European agriculture-water activities. Peter Kristensen European Topic Centre on Water. Inventory of European activities.

E N D
Overview of Europeanagriculture-water activities Peter Kristensen European Topic Centre on Water
Inventory of European activities • During the last 15 years many European, regional and national activities have been undertaken in relation to agriculture and water/ nutrients. For example, national studies on assessment of diffuse pollution, nutrient balance, and R&D activities on catchment modelling of diffuse pollution. • Structured overview of activities related to: • Agriculture nutrient input/balances and calculated water quality • Relationship between water quality and agricultural activities • Modelling approaches and scenarios • Draft technical report (10-15 p.) next month (circulated to experts for comments)
Structured overview of agri-water activities • Country overview • 31 EEA countries • Relevant scientific papers • “Grey” reports • State of the environment reports (water chapters) Scientific papers State of water reports Overviewof activities related to: - Agriculture nutrient input/ balances and calculated water quality - Relationship between water quality and agricultural activities - Modelling approaches and scenarios
Many studies describe trends in nutrient input, nutrient surplus and in some cases these information are used to calculate nutrient leaching/run-off to groundwater and surface water. nutrient balances on European scale; attempts to spatialise nutrient balances to rivers basin scale losses/leaching of nutrients Agriculture nutrient input/balances and calculated water quality
European nutrient balances EEA 2005: IRENA 18 Gross Nutrient Balances Eurostat 2000 Nutrient balances OECD 2001 & 2005 CAPRI 2003 (Used as impact indicator for evaluating the effect of the CAP reform) Soil surface balances Nitrogen balances National/ administrative level Standard coefficients N-surplus kg/ha agri Source: JRC N-surplus 1990 & 2000 Source: EEA/OECD
Spatialise During the last years there have been activities to “spatialise” the calculated nutrient balances on administrative levels to river catchments using information on agricultural land cover European scale Crouzet P/EEA 2001: Calculation of nutrient surpluses from agricultural sources - Statistics spatialisation by means of CORINE land cover JRC 2002: Calculation of Agricultural Nitrogen Quantity for EU River Basins. Catchment/regional level Bogena H., Goemann H., Kreins P., Kunkel R.und Wendland F. 2004: Use of CORINE land cover data for modelling water balance and nitrogen fluxes in the river Ems and the river Rhine. Jordan C., & Smith R.V. 2004/05: Methods to predict the agricultural contribution to catchment nitrate loads: designation of nitrate vulnerable zones in Northern Ireland. Journal of Hydrology xx (2004) 1–14. Dunn, S.M., Vinten, A.J.A., Lilly, A., DeGroote, J. and McGechan, M., 2004: Nitrogen risk assessment model for Scotland: I. Nitrogen leaching, Hydrology and Earth Systems Sciences, 8, 191-204.
Source: Terres JM 2002: Calculation of Agricultural Nitrogen Quantity for EU15, spatialisation of the results to river basins using CORINE Land Cover.
Scotland nitrogen surplus 1990 Scotland leached N 1990 Excess water Source:Dunn, S.M., Vinten, A.J.A., Lilly, A., DeGroote, J. and McGechan, M., 2004: Nitrogen risk assessment model for Scotland: I. Nitrogen leaching, Hydrology and Earth Systems Sciences, 8, 191-204
EEA (RIVM)1995 Calculated concentration of nitrate in the leachate from agricultural soils (at 1 metre depth) ? When is the next time such a map can be produced? How to illustrate temporal trends?
Attempts to calculate European wide downstream river nutrient concentrations 1990 and 2010 as a basis for establishing the 6th environmental action programmeSource: Wieringa, K., 2001. European Environmental Priorities: an Integrated Economic and Environmental Assessment. RIVM Report no. 481505010, National Institute for Public Health and the Environment, Bilthoven, the Netherlands.
Reviews Schoumans, O.F. & Silgram, M. 2003. Review and Literature Evaluation of Quantification Tools for the Assessment of Nutrient Losses at Catchment Scale. EUROHARP Arheimer, B., J. Olsson, 2003, Integration and Coupling of Hydrological Models with Water Quality Models: Application in Europe, World Meteorological Organisation/ Hydrological Operational Multipurpose System, 2003. EUROHARP testing The Register of Ecological Models (REM) Models Catchment scale: AGNPS, HBV-N, INCA, MAGIC, MERLIN, SHE, MIKESHE, SHETRAN, SMART, SWAT, TRANS, MONERIS, MODEST, NIIRS, PolFlow, LOIS, CHESS, OPUS), Soil water and field scale: ANIMO, EPIC, GLEAMS, HYDRUS/SWMS, MACRO, SOILN, WAVE, DAISY, DRAINMOD, NLEAP, RENLEM2, PTARG, SIMPLE, TOPMODEL, River Channels and water flow and quality: AQUASIM, CE-QUAL, MIKE 11, PC-QUASAR (UK), QUAL2E, TELEMAC, Decision support systems: BASINS, MIKE BASIN (DK), NELUP) and national level (STONE, NIRAMS (UK)). + several more Quantification tools of nutrient losses
Most European countries have water quality monitoring programmes where nutrients and other pollutants are measured in different types of water bodies (groundwater, rivers, lakes, coastal and marine waters) and there are made assessment of the loading of nutrients from large river and coastal areas catchments. Relationship between observed water quality and agricultural activities
Water quality monitoring • Long-term trend • Many national monitoring programmes have been running for 20-40 years – a good basis for evaluating trend • Are there indications of decreasing nitrate concentration? River stations – EIONET Water EUROWATERNET Nitrate in groundwater More than 3000 river stations from more than 30 countries – timeseries for many stations from 1992-2002 Source: CEC 2002 Implementation of Nitrate Directive
Temporal trend in nutrient concentrations and related to change in agricultural activities. Nitrate in rivers and fertiliser consumption Proxy indicator for intensive agricultural production (high livestock density etc.) 5 year running average
Many national monitoring programmes have been running for 20-40 years – good basis for evaluating trend 25 % of monitoring stations on Europe's rivers recorded a decrease between 1992 and 2001. However, around 15 % of river monitoring stations showed an increasing trend in nitrate concentrations over the same period.Source: EEA Signals 2004 In Ireland increasing nitrate trend (1979-2000) has been observed for the agricultural impacted south eastern rivers, while the concentration level has been constant for the western rivers Source: SoE 2004 Germany Trend in nitrate levels in 154 river sites; annual average nitrate concentration is higher than 5 mg N/l if category are III or higher Source: Umweltbundesamt
Reporting of national monitoring programmes The Netherlands: agricultural streams (Landbouw); lakes (meeren) and the river Rhine (German-Dutch border); Denmark: agricultural streams (with and without point sources: fish farms & uncultivated
Spatial relationship between water quality (nutrient concentration & load) and agricultural activities Relationship between nitrate concentration and percentage of agricultural land in large rivers in Europe (Kristensen, 1996).
Spatial relationship between water quality (nutrient concentration & load) and agricultural activities Relationship between nitrogen/ phosphorus concentration and the proportion of agricultural land for 70 Danish streams Relationship between nitrogen concentration and the proportion of agriculture land for 75 rivers discharging into the Baltic Source: Ley (1997) – LNF Anteil der landwirtschaftlichen Nutzfläche (LNF) Source: Kronvang et al. 2005
EFMA fertiliser projections EU15 Member States New 10 Member States
CAPRI (2003) - Common Agricultural Policy Regional Impact Assessment Scenarios on Agenda 2000 reference run & the CAP Reform Proposal 2003. Results comparison of base year (1998) & 2009 N-surplus for EU15; regions (nuts 02) & farm types. Change N-surplus at soil level: Agenda 2000 versus base year situation From dark green to light green: between –18 % and –2 %, white around –1 % and from light red to dark red between 1 % and 25 %.
Examples of national scenarios RIVM 2000- National Environmental Outlook 5: - Situation after existing policies have been implemented Møller C., Kreins P., and Gömann H. 2003: Impact and cost-efficiency of alternative policy measures to reduce diffuse pollution caused by agriculture. Diffuse Pollution Conference Dublin 2003 RAUMIS – modelling for 2010 - Reference (Agenda 2000) - Scenario1 - LU - Scenario 2 – fertiliser tax Reference 2010 Maximum 1 livestock unit/ ha
Bridging the Gap between specific national – R&D studies and European environmental information and policy development Much good information as a basis for European agri-water assessments
Figure 3: Relationship between river nitrate concentration and percentage of arable land (land ploughed) and nitrogen fertiliser consumption. Source: Neill, 1981 Figure 2 Relationship between percentage of rivers with nitrate greater than 20 NO3/l and total application of nitrogen (fertilisers and manure).