Download
1 / 64
660 likes | 941 Views
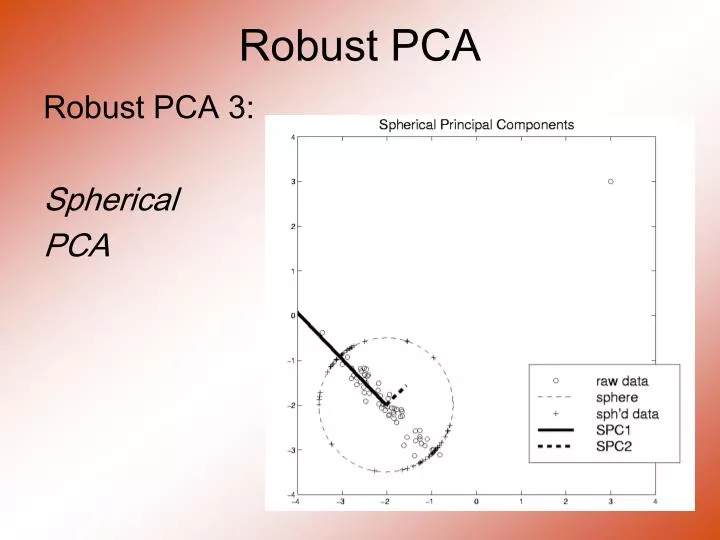
Robust PCA. Robust PCA 3: Spherical PCA. Robust PCA. Spherical PCA Problem : Magnification of High Freq. Coeff ’ s Solution : Elliptical Analysis Background ( Univariate ): MAD = Median Absolute Deviation MAD =

E N D
Robust PCA Robust PCA 3: Spherical PCA
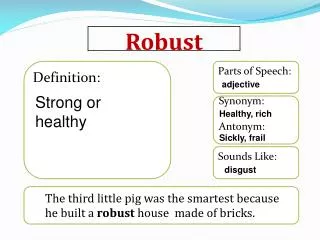
Robust PCA Spherical PCA Problem : Magnification of High Freq. Coeff’s Solution : Elliptical Analysis Background (Univariate): MAD = Median Absolute Deviation MAD = Simple, High Breakdown, Outlier Resistant, Measure of “Scale”
Robust PCA Rescale Coords Spherical PCA Unscale Coords
Aside On Visualization Another Multivariate Data Visualization Tool: Parallel Coordinates Forgot to Give Citations: Inselberg (1985, 2009)
Big Picture View of PCA Alternate Viewpoint: Gaussian Likelihood • When data are multivariate Gaussian • PCA finds major axes of ellipt’al contours of Probability Density • Maximum Likelihood Estimate Mistaken idea: PCA only useful for Gaussian data
Big Picture View of PCA Raw Cornea Data: Data – Median (Data – Median) ------------------- MAD
Big Picture View of PCA Mistaken idea: PCA only useful for Gaussian data Toy Example: Each Marginal Binary Clearly NOT Gaussian n = 100, d = 4000
Big Picture View of PCA Mistaken idea: PCA only useful for Gaussian data But PCA Reveals Trimodal Structure
Correlation PCA A related (& better known) variation of PCA: Replace cov. matrix with correlation matrix I.e. do eigen analysis of Where
Transformations Another Feature with Large Values Approach: Shifted Log: Need to Tune
Transformations Much Nicer Distribution
Transformations Useful Visualization: MargDistPlot Change Summary To Skewness Most/Least Symmetric
Clusters in data Common Statistical Task: Find Clusters in Data • Interesting sub-populations? • Important structure in data? • How to do this? PCA provides very simple approach There is a large literature of other methods (will study more later)
PCA to find clusters Recall Toy Example with more clusters:
PCA to find clusters Best revealed by 2d scatterplots (4 clusters):
PCA to find clusters A deeper example: Mass Flux Data • Data from EnricaBellone, • National Center for Atmospheric Research • Mass Flux for quantifying cloud types • How does mass change when moving into a cloud
PCA to find clusters PCA of Mass Flux Data:
PCA to find clusters Summary of PCA of Mass Flux Data: • Mean: Captures General Mountain Shape • PC1: Generally overall height of peak • shows up nicely in mean +- plot (2nd col) • 3 apparent clusters in scores plot • Are those “really there”? • If so, could lead to interesting discovery • If not, could waste effort in investigation
PCA to find clusters Summary of PCA of Mass Flux Data: PC2: Location of peak • again mean +- plot very useful here PC3: Width adjustment • again see most clearly in mean +- plot Maybe non-linear modes of variation???
PCA to find clusters Return to Investigation of PC1 Clusters: • Can see 3 bumps in smooth histogram Main Question: Important structure or sampling variability? Approach: SiZer (SIgnificance of ZERo crossings of deriv.)
Statistical Smoothing In 1 Dimension (Numbers as Data Objects)
Statistical Smoothing In 1 Dimension, 2 Major Settings: • Density Estimation “Histograms” • Nonparametric Regression “Scatterplot Smoothing”
Density Estimation E.g. Hidalgo Stamp Data • Thicknesses of Postage Stamps • Produced in Mexico • Over ~ 70 years • During 1800s • Paper produced in several factories? • How many factories? (Records lost) • Brought to statistical literature by: Izenman and Sommer (1988)
Density Estimation E.g. Hidalgo Stamp Data • Thicknesses of Postage Stamps • Produced in Mexico • Over ~ 70 years • During 1800s • Paper produced in several factories? (Thicknesses vary by up to factor of 2)
Density Estimation E.g. Hidalgo Stamp Data • A histogram • “Oversmoothed” • Bin Width too large? • Miss important structure?
Density Estimation E.g. Hidalgo Stamp Data • Another histogram • Smaller binwidth • Suggests 2 modes? • 2 factories making the paper?
Density Estimation E.g. Hidalgo Stamp Data • Another histogram • Smaller binwidth • Suggests 6 modes? • 6 factories making the paper?
Density Estimation E.g. Hidalgo Stamp Data • Another histogram • Even smaller binwidth • Suggests many modes? • Really believe modes are “there”? • Or just sampling variation?
Density Estimation E.g. Hidalgo Stamp Data • Critical Issue for histograms: Choice of binwidth (well understood?)
Histograms Less Well Understood issue: • Choice of bin location • Major impact on number of modes (2-7) • All for samebinwidth
Histograms Choice of bin location: • What is going on? • Compare with Average Histogram
Density Estimation Compare shifts with Average Histogram • For 7 mode shift • Peaks line up with bin centers • So shifted histo’s find peaks
Density Estimation Compare shifts with Average Histogram • For 2 (3?) mode shift • Peaks split between bins • So shifted histo’s miss peaks
Density Estimation Histogram Drawbacks: • Need to choose bin width • Need to choose bin location • But Average Histogram reveals structure • So should use that, instead of histo Name: Kernel Density Estimate
Kernel Density Estimation Chondrite Data: • Stony (metal) Meteorites (hit the earth) • So have a chunk of rock • Study “% of silica” • From how many sources? • Only 22 rocks… • Histogram hopeless? • Brought to statistical literature by: Good and Gaskins (1980)
Kernel Density Estimation Chondrite Data: • Represent points by red bars • Where are data “more dense”?
Kernel Density Estimation Chondrite Data: • Put probability mass 1/n at each point • Smooth piece of “density”
Kernel Density Estimation Chondrite Data: • Sum pieces to estimate density • Suggests 3 modes (rock sources)
Kernel Density Estimation Mathematical Notation: Where • Window shape given by “kernel”, • Window width given by “bandwidth”,
Kernel Density Estimation Mathematical Notation: This Was Used In PCA Graphics
Kernel Density Estimation Choice of kernel (window shape)? • Controversial issue • Want Computational Speed? • Want Statistical Efficiency? • Want Smooth Estimates? • There is more, but personal choice: Gaussian • Good Overall Reference: Wand and Jones (1994)
Kernel Density Estimation Choice of bandwidth (window width)? • Very important to performance Fundamental Issue: Which modes are “really there”?
Density Estimation How to use histograms if you must: • Undersmooth (minimizes bin edge effect) • Human eye is OK at “post-smoothing”
Statistical Smoothing 2 Major Settings: • Density Estimation “Histograms” • Nonparametric Regression “Scatterplot Smoothing”
Scatterplot Smoothing E.g. Bralower Fossil Data Prof. of Geosciences Penn. State Univ.
Scatterplot Smoothing E.g. Bralower Fossil Data • Study Global Climate • Time scale of millions of years • Data points are fossil shells • Dated by surrounding material • Ratio of Isotopes of Strontium (differences in 4th decimal point!) • Surrogate for Sea Level (Ice Ages) • Data seem to have structure…
Scatterplot Smoothing E.g. Bralower Fossil Data
Scatterplot Smoothing E.g. Bralower Fossil Data • Way to bring out structure: Smooth the data • Methods of smoothing? • Local Averages • Splines (several types) • Fourier – trim high frequencies • Other bases • … • Also controversial
Scatterplot Smoothing E.g. Bralower Fossil Data – some smooths
Scatterplot Smoothing A simple approach: local averages Given data: Model in regression form: How to estimate ?