Download
1 / 1
10 likes | 143 Views
P2.13. Evaluation of Persistent Cold Season Cold-Air Pools in the Salt Lake Valley, Utah Christopher J. Ander, John D. Horel & C. David Whiteman Department of Atmospheric Sciences, University of Utah . 1. Introduction. 4. Conclusions. 3. Results.

E N D
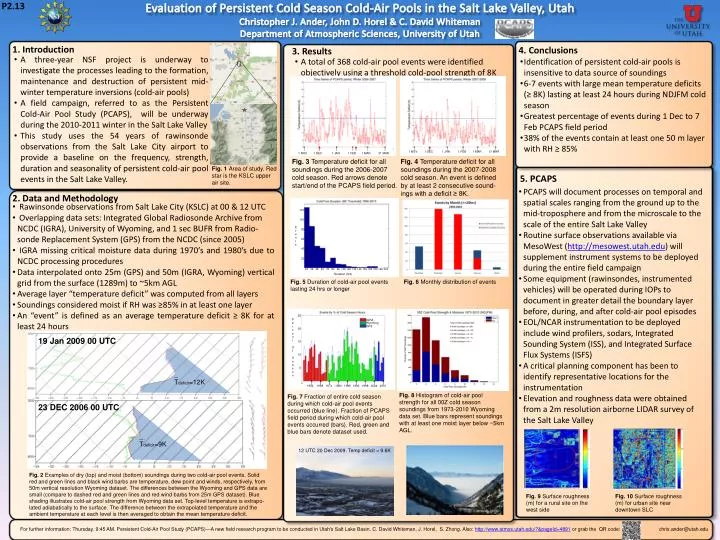
P2.13 Evaluation of Persistent Cold Season Cold-Air Pools in the Salt Lake Valley, Utah Christopher J. Ander, John D. Horel & C. David Whiteman Department of Atmospheric Sciences, University of Utah 1. Introduction 4. Conclusions 3. Results • A three-year NSF project is underway to investigate the processes leading to the formation, maintenance and destruction of persistent mid-winter temperature inversions (cold-air pools) • A field campaign, referred to as the Persistent Cold-Air Pool Study (PCAPS), will be underway during the 2010-2011 winter in the Salt Lake Valley • This study uses the 54 years of rawinsondeobservations from the Salt Lake City airport to provide a baseline on the frequency, strength, duration and seasonality of persistent cold-air pool events in the Salt Lake Valley. • A total of 368 cold-air pool events were identified objectively using a threshold cold-pool strength of 8K • Identification of persistent cold-air pools is insensitive to data source of soundings • 6-7 events with large mean temperature deficits (≥ 8K) lasting at least 24 hours during NDJFM cold season • Greatest percentage of events during 1 Dec to 7 Feb PCAPS field period • 38% of the events contain at least one 50 m layer with RH ≥ 85% Time Series of 2006-2007 Cold Season Temperature Deficits Time Series of 2007-2008 Cold Season Temperature Deficits 1 NOV 1 DEC 1 JAN 1 FEB 1 MAR 31 MAR 1 NOV 1 DEC 1 JAN 1 FEB 1 MAR 31 MAR Fig. 3 Temperature deficit for all soundings duringthe 2006-2007 cold season. Red arrows denote start/end of the PCAPS field period. Fig. 4 Temperature deficit for all soundings duringthe 2007-2008 cold season. An event is defined by at least 2 consecutive sound-ings with a deficit ≥ 8K. Fig. 1 Area of study. Red star is the KSLC upper air site. 5. PCAPS • PCAPS will document processes on temporal and spatial scales ranging from the ground up to the mid-troposphere and from the microscale to the scale of the entire Salt Lake Valley • Routine surface observations available via MesoWest (http://mesowest.utah.edu) willsupplementinstrument systems to be deployed during the entire field campaign • Some equipment (rawinsondes, instrumented vehicles) will be operated during IOPs to document in greater detail the boundary layer before, during, and after cold-air pool episodes • EOL/NCAR instrumentation to be deployed include wind profilers, sodars, Integrated Sounding System (ISS), and Integrated Surface Flux Systems (ISFS) • A critical planning component has been to identify representative locations for the instrumentation • Elevation and roughness data were obtained from a 2m resolution airborne LIDAR survey of the Salt Lake Valley gpegpe 2. Data and Methodology • Rawinsonde observations from Salt Lake City (KSLC) at 00 & 12 UTC • Overlapping data sets: Integrated Global Radiosonde Archive from NCDC (IGRA), University of Wyoming, and 1 sec BUFR from Radio-sonde Replacement System (GPS) from the NCDC (since 2005) • IGRA missing critical moisture data during 1970’s and 1980’s due to NCDC processing procedures • Data interpolated onto 25m (GPS) and 50m (IGRA, Wyoming) vertical grid from the surface (1289m) to ~5km AGL • Average layer “temperature deficit” was computed from all layers • Soundings considered moist if RH was ≥85% in at least one layer • An “event” is defined as an average temperature deficit ≥ 8K for at least 24 hours 120 100 Events 80 60 40 20 24 36 48 60 72 84 96 106 120 132 144 156 168 180 192 204 Duration (hrs) Fig. 5 Duration of cold-air pool events lasting 24 hrs or longer Fig. 6 Monthly distribution of events IGRA Wyoming GPS 19 Jan 2009 00 UTC 25 Percent Of Season 20 15 _ Tdeficit=12K 10 Fig. 8 Histogram of cold-air pool strength for all 00Z cold season soundings from 1973-2010 Wyoming data set. Blue bars represent soundings with at least one moist layer below ~5km AGL. 5 Fig. 7 Fractionof entire cold season during which cold-air pool events occurred (blue line). Fraction of PCAPS field period during which cold-air pool events occurred (bars). Red, green and blue bars denote dataset used. 23 DEC 2006 00 UTC 1962 1968 1974 1980 1986 1992 1998 2004 2010 _ Tdeficit=9K 12 UTC 20 Dec 2009. Temp deficit = 9.6K Fig. 8 Same as in figure 7 for the 1 December-7 February period. Fig. 2 Examples of dry (top) and moist (bottom) soundings during two cold-air pool events. Solid red and green lines and black wind barbs are temperature, dew point and winds, respectively, from 50m vertical resolution Wyoming dataset. The differences between the Wyoming and GPS data are small (compare to dashed red and green lines and red wind barbs from 25m GPS dataset). Blue shading illustrates cold-air pool strength from Wyoming data set. Top-level temperature is extrapo-lated adiabatically to the surface. The difference between the extrapolatedtemperature and the ambient temperature at each level is then averaged to obtain the mean temperature deficit. Fig. 9Surface roughness (m) for a rural site on the west side Fig. 10Surface roughness (m) for urban site near downtown SLC For further information: Thursday. 9:45 AM. Persistent Cold-Air Pool Study (PCAPS)—A new field research program to be conducted in Utah's Salt Lake Basin. C. David Whiteman, J. Horel, S. Zhong. Also: http://www.atmos.utah.edu/?&pageId=4891 or grab the QR code: chris.ander@utah.edu