Download
1 / 28
280 likes | 555 Views
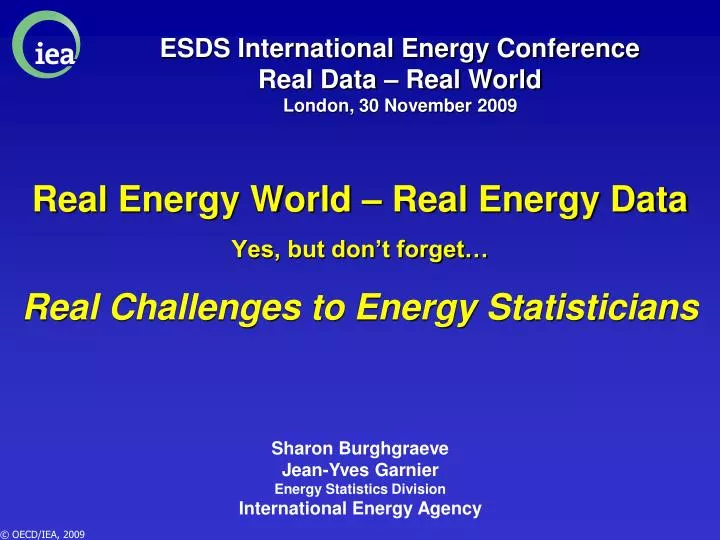
ESDS International Energy Conference Real Data – Real World London, 30 November 2009. Real Energy World – Real Energy Data Yes, but don’t forget… Real Challenges to Energy Statisticians. Sharon Burghgraeve Jean-Yves Garnier Energy Statistics Division International Energy Agency.

E N D
ESDS International Energy ConferenceReal Data – Real WorldLondon, 30 November 2009 Real Energy World – Real Energy Data Yes, but don’t forget… Real Challenges to Energy Statisticians Sharon Burghgraeve Jean-Yves Garnier Energy Statistics Division International Energy Agency
Real Energy World Energy is “a” (if not “the”) key element of global economy Energy markets are becoming more and more global CO2 emissions from fuel combustion represent the largest share of greenhouse gases (GHG)
Energy is “a” (if not “the”) key elementof global economy Example of oil: Daily production November oil price Days per year 80$/bl 85 Mbl/day x 80 $/bl x 365 6 800 million US$/day 1.4 x GDP of UK 2 500 billion US$
Energy markets are becoming more and more global x 2 + 171% Energy consumption Energy consumption 44% 59% + 46% More energy is now consumed outside the IEA than in IEA member countries Underlying factors: Overall IEA GDP “only” increased by 140% compared to 270% for non-IEA. As a consequence, the share of IEA in global GDP dropped from 81% to 74%, and from 63% to 51% in GDP PPP Total IEA population increased by 220 million compared to 2 400 million for non-IEA Average IEA energy intensity (consumption/GDP) is the lowest of the above countries/regions
CO2 emissions from fuel combustion represent the largest share of greenhouse gases (GHG) World Annex I countries Energy-related CO2 contribution to GHG emissions
Non OECD Europe (11 countries) Former Soviet Union (15 countries) Asia (17 countries) Middle East (13 countries) Latin America (22 countries) Africa (26 countries) Real Energy Data OECD (30 countries) A coverage of over 130 countries, 95 flows and 75 energy products The contribution of the IEA to provide a global energy data coverage
CDs The contribution of the IEA to provide a global energy data coverage Books Internet
The challenge passed to the international energy statistics community: A need to further improve quality and coverage A few selected examples of concrete actions taken by the IEA (together with other organisations: The Energy Statistics Manual (with Eurostat) The JODI initiative (7 organisations) InterEnerStat(21 organisations) The Energy Efficiency Template (EU ODYSSEE, APEC)
The Energy Statistics Manual (with Eurostat) French German Spanish Turkish Indonesian Russian Chinese An Arabic version is under preparation Facilitating the understanding of energy statistics
UN 1995 1996 1997 1998 APEC 2653 2903 3087 3134 IEA 2741 2872 3062 3109 OLADE 2722 2969 3022 3070 OPEC 2618 2858 3022 3071 UN 2834 2977 3166 Crude Oil Production for Mexico (in kbd) 3210 The Joint Oil Date Initiative (JODI)(APEC, Eurostat, IEA, IEFS, OLADE, OPEC, UNSD) Secretaria de Energía Mexico 5% gap
A simple format (42 data points) Month -1 and month -2 Choice of units left to organisations Simple definitions A joint questionnaire as simple as possible JOINT APERC/EUROSTAT/OECD-IEA/ OLADE/OPEC/UN DATA EXERCISE Country: Month: Unit:
Nine years of hard work and cooperation RomeMay 08 DohaMay 06 RiyadhNov 06 QuitoJune 09 ParisOct 08 ViennaSep 06 RiyadhNov 05 ParisNov 07 ViennaMar 09 Luxem. June 08 N York May 06 BaliOct 04 Luxem.Jan 06 ParisNov 05 ParisJul 05 CairoOct 03 Launch of the JODI Database Amst.May 04 RiyadhJan 05 ViennaJun 04 OsakaSep 02 ParisDec 03 MexicoMay 02 ViennaJan 03 RiyadhNov. 01 ParisJuly 02 Current development Extension to natural gas Extension to additional annual data BangkokApr 01 ViennaApr 02 RiyadhNov 00 Luxem.Jan 02 MadridJuly 00 ViennaOct 01 ViennaMay 01 ParisNov 00 International Energy Forum Conferences JODI Conferences Inter-Secretariat Working Group Meetings Amst.May 04 MexicoMay 02 ParisDec 03
Improvement in JODI performance ☺ 82 71 15.5% ☺ 54 48 12.5% ☺ 64 55 16.4% 72 countries have reported M-1 data in April 2009 (compared to almost none in 2002) Major progress in timeliness M-1 vs. M-2
InterEnerStat21 international/regional organisations • An extension of JODI to all fuels and all flows • An extension to data provider and user organisations • Priority given to harmonisation
Close to an agreement on harmonised definitions 4thInterEnerStat Meeting, IEA, October 2009
UN EUROSTAT OAPEC OPEC Harmonisation of definitions, a first step towards a common questionnaire FAO AFREC ?
World abatement of energy-related CO2 emissionsin the 450 Scenario The Energy Efficiency Template Gt 42 Reference Scenario World abatement by technology 40 38 2020 3.8 Gt 2030 13.8 Gt OECD+ 36 34 Efficiency 13.8 Gt 57% 65% 3.8 Gt 32 OME 30 Renewables & biofuels 23% 19% OC 28 Nuclear 10% 450 Scenario CCS 13% 10% 26 3% 2007 2010 2015 2020 2025 2030 • Two-thirds of CO2 reduction should come from energy efficiency by 2010; 57% by 2030
The problem is that current data are not detailed enough for sound energy efficiency policy TPES/GDP TPES/Production Electricity Cons./Population Aggregated Indicators CO2/GDP PPP Efficiency Elec. Prod. Cons./ton cement Disaggregated Indicators Heating Cons./sqm/DD Litre/100km (stock) Only a minimum set of indicators can be derived from basic statistics Dry process Process Efficiency Condensing boiler Litre/100km (vintage) The Indicator Pyramid
Lack of proper indicators could lead to major uncertainties for formulating action plans Services And the 1st priority is... Industry Industry! Residential And the last priority is... Transport Residential! So, the need to act and react
In consultation with APEC, the ODYSEE, the IEA has developed a questionnaire on energy efficiencies After several years of negotiations, Ministers have just agreed to adopt this new questionnaire
Examples of detailed informationto be collected RESIDENTIAL % 106 kWh/unit
What about new challenges faced by energy statisticians at the country level • Liberalisation of the market: From one company to hundreds • Confidentiality (linked to liberalisation) • More work passed to statistics offices: • More companies to survey (liberalisation) • Renewables (remote information) • Energy efficiency indicators (including socio-economic data) • Environment (estimation of GHG emissions, ….) • etc. • Resources do not follow work load:Statistics still have a low profile, budget cuts
More work and fewer resources Please Help Me… A need to raise the profile of energy statistics and statisticians
Raising the profile of statistics and the role of statisticians Current situation No direct link between policy makers and statisticians
In fact, the relationship between policy makers, analysts and statisticians should be more based on a 3-way street • Decision makers • Need the right data immediately • Allocation of resources • The ones who do the work • Should be fully involved in the whole process • Statisticians need to understand why they collect the data • Policy makers need to understand the problems faced by statisticians • Prime users of the data • Advisors to policy makers • Interface between policy makers and statisticians • Lobby • Comments on data
JODI has been a major contributor for raising the profile On 19 November 2005, an example of how the profile of statistics can be raised is the launch of the JODI Database by King Abdullah
Real Data – Real World Assess the past to better understand the present Feed the debate on climate change Energy Statistics Review the energy market Forecast the evolution of the energy situation
A Few Words to Conclude The real world needs more and better data Harmonisation and cooperation are two key words to provide more and better real data The IEA is very active to improve quality and coverage for OECD countries and worldwide However policy makers should understand the challenges passed to their statisticians Thank you